

Differential expression of IFN-alpha and TRAIL/DR5 in lymphoid tissue of progressor versus nonprogressor HIV-1-infected patients
- PMID: 16632604
- PMCID: PMC1444883
- DOI: 10.1073/pnas.0600363103
Differential expression of IFN-alpha and TRAIL/DR5 in lymphoid tissue of progressor versus nonprogressor HIV-1-infected patients
Abstract
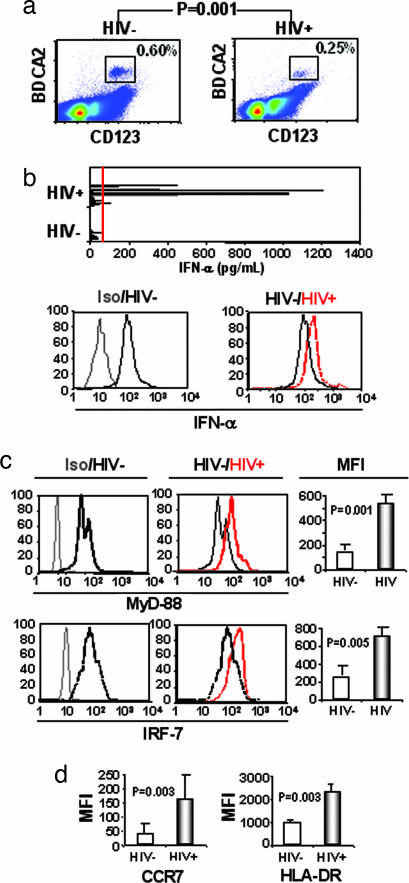
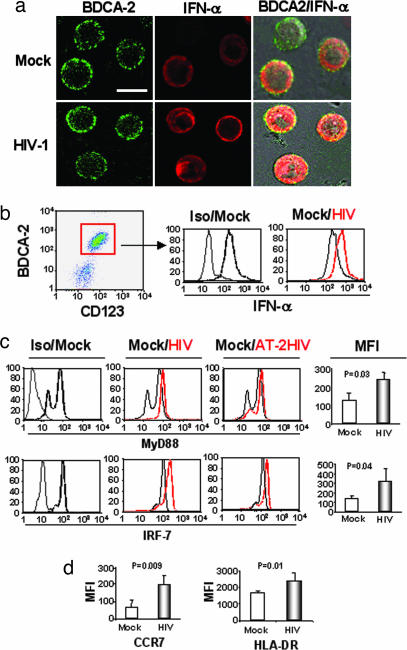
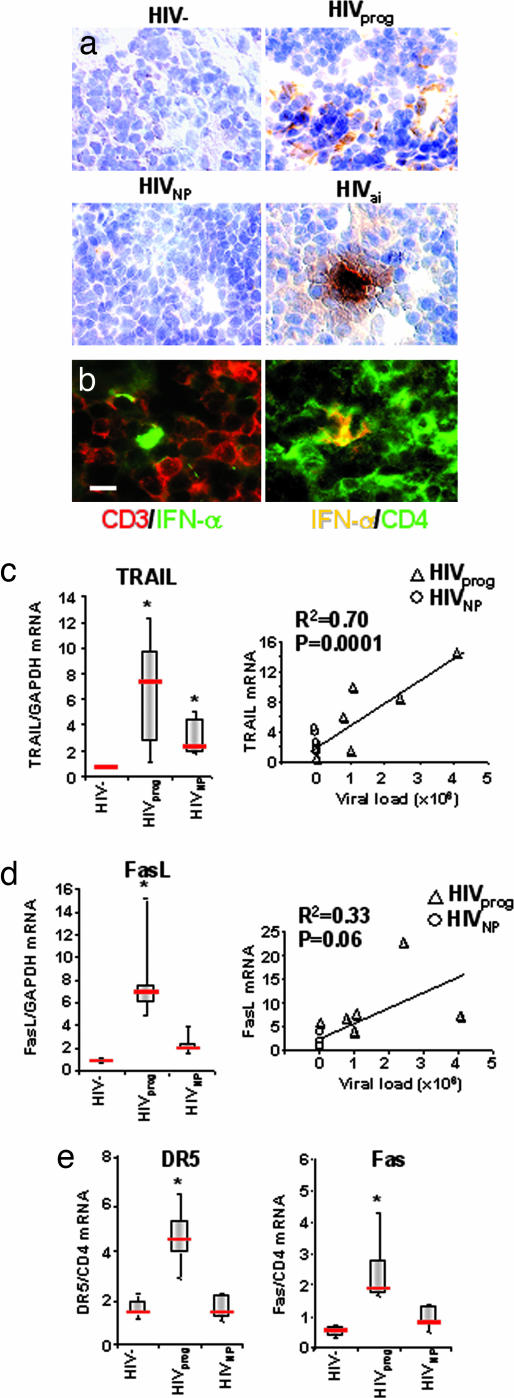
Loss of CD4+ T cells, the hallmark of HIV pathogenesis, was suggested to be partly due to apoptosis. We recently reported that IFN-alpha produced by HIV-1-activated plasmacytoid dendritic cells (pDCs) contributes to CD4+ T cell apoptosis by the TNF-related apoptosis-inducing ligand (TRAIL)/death receptor (DR)5 pathway. Here, we show that HIV-1-induced intracellular expression of IFN-alpha in pDCs is coupled to increased expression of IFN regulatory factor 7 and MyD88 by pDCs in vivo and in vitro. Expression of IFN-alpha was increased in lymphoid tonsillar tissue (LT) of patients with progressive (HIV(prog)) compared with nonprogressive (HIV(NP)) HIV-1 disease and to uninfected controls. LT from HIV(prog) exhibited higher TRAIL and DR5 mRNA levels than LT from HIV(NP) or controls. TRAIL mRNA levels in LT correlated with plasma viral load. We show that HIV-1 induces IFN-alpha and the TRAIL/DR5 apoptotic pathway in LT, suggesting a role for these cytokines in HIV-1 immunopathogenesis.
Conflict of interest statement
Conflict of interest statement: No conflicts declared.
Figures
Similar articles
-
Inability of plasmacytoid dendritic cells to directly lyse HIV-infected autologous CD4+ T cells despite induction of tumor necrosis factor-related apoptosis-inducing ligand.J Virol. 2010 Mar;84(6):2762-73. doi: 10.1128/JVI.01350-09. Epub 2009 Dec 30. J Virol. 2010. PMID: 20042498 Free PMC article.
-
CD4+ T-cell death induced by infectious and noninfectious HIV-1: role of type 1 interferon-dependent, TRAIL/DR5-mediated apoptosis.Blood. 2005 Nov 15;106(10):3524-31. doi: 10.1182/blood-2005-03-1243. Epub 2005 Jul 26. Blood. 2005. PMID: 16046522 Free PMC article.
-
Are blockers of gp120/CD4 interaction effective inhibitors of HIV-1 immunopathogenesis?AIDS Rev. 2006 Jan-Mar;8(1):3-8. AIDS Rev. 2006. PMID: 16736946 Review.
-
Regulation of TNF-related apoptosis-inducing ligand on primary CD4+ T cells by HIV-1: role of type I IFN-producing plasmacytoid dendritic cells.Proc Natl Acad Sci U S A. 2005 Sep 27;102(39):13974-9. doi: 10.1073/pnas.0505251102. Epub 2005 Sep 20. Proc Natl Acad Sci U S A. 2005. PMID: 16174727 Free PMC article.
-
HIV-1 immunopathogenesis: how good interferon turns bad.Clin Immunol. 2007 May;123(2):121-8. doi: 10.1016/j.clim.2006.09.016. Epub 2006 Nov 16. Clin Immunol. 2007. PMID: 17112786 Free PMC article. Review.
Cited by
-
Dengue virus activates membrane TRAIL relocalization and IFN-α production by human plasmacytoid dendritic cells in vitro and in vivo.PLoS Negl Trop Dis. 2013 Jun 6;7(6):e2257. doi: 10.1371/journal.pntd.0002257. Print 2013. PLoS Negl Trop Dis. 2013. PMID: 23755314 Free PMC article.
-
The initial interplay between HIV and mucosal innate immunity.Front Immunol. 2023 Jan 30;14:1104423. doi: 10.3389/fimmu.2023.1104423. eCollection 2023. Front Immunol. 2023. PMID: 36798134 Free PMC article. Review.
-
Blood myeloid dendritic cells from HIV-1-infected individuals display a proapoptotic profile characterized by decreased Bcl-2 levels and by caspase-3+ frequencies that are associated with levels of plasma viremia and T cell activation in an exploratory study.J Virol. 2011 Jan;85(1):397-409. doi: 10.1128/JVI.01118-10. Epub 2010 Oct 20. J Virol. 2011. PMID: 20962079 Free PMC article.
-
Spatiotemporal trafficking of HIV in human plasmacytoid dendritic cells defines a persistently IFN-α-producing and partially matured phenotype.J Clin Invest. 2011 Mar;121(3):1088-101. doi: 10.1172/JCI44960. Epub 2011 Feb 21. J Clin Invest. 2011. PMID: 21339641 Free PMC article.
-
The enduring tale of T cells in HIV immunopathogenesis.Indian J Med Res. 2013 Nov;138(5):682-99. Indian J Med Res. 2013. PMID: 24434321 Free PMC article. Review.
References
-
- Colonna M., Trinchieri G., Liu Y. J. Nat. Immunol. 2004;5:1219–1226. - PubMed
-
- Schmidt B., Ashlock B. M., Foster H., Fujimura S. H., Levy J. A. Virology. 2005;343:256–266. - PubMed
-
- Yamamoto J. K., Barre-Sinoussi F., Bolton V., Pedersen N. C., Gardner M. B. J. Interferon. Res. 1986;6:143–152. - PubMed
-
- Siegal F. P., Kadowaki N., Shodell M., Fitzgerald-Bocarsly P. A., Shah K., Ho S., Antonenko S., Liu Y. J. Science. 1999;284:1835–1837. - PubMed
Publication types
MeSH terms
Substances
Grants and funding
LinkOut - more resources
Full Text Sources
Other Literature Sources
Medical
Research Materials
Miscellaneous
