. 2006 May 2;103(18):7186-91.
doi: 10.1073/pnas.0509550103. Epub 2006 Apr 21.

Computational and neurobiological mechanisms underlying cognitive flexibility

Affiliations

Computational and neurobiological mechanisms underlying cognitive flexibility

David Badre et al. Proc Natl Acad Sci U S A. .

Abstract

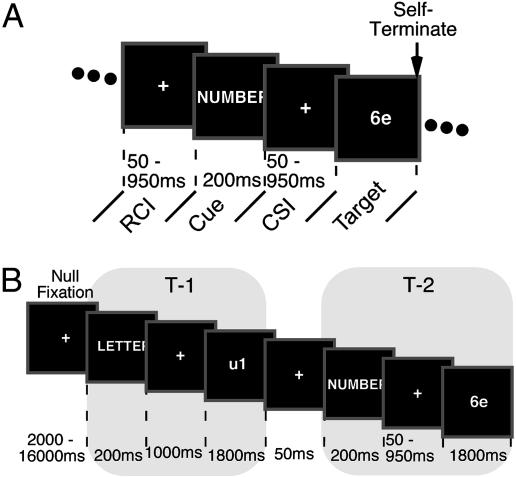
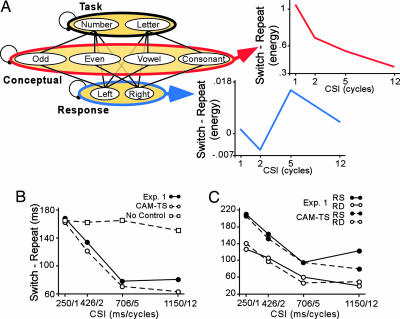
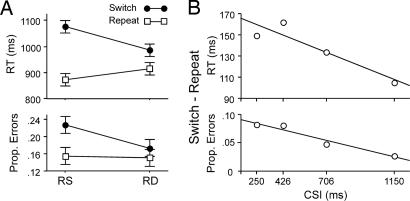
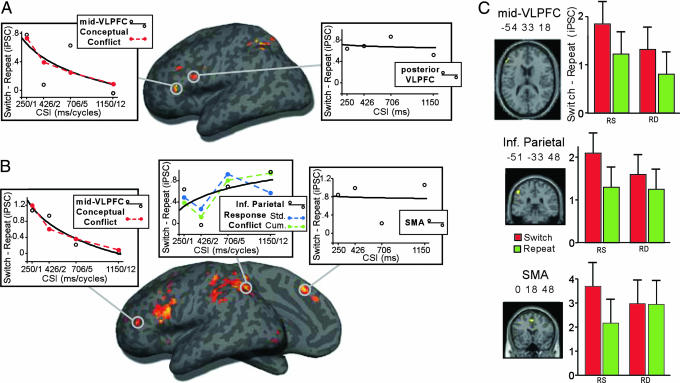
The ability to switch between multiple tasks is central to flexible behavior. Although switching between tasks is readily accomplished, a well established consequence of task switching (TS) is behavioral slowing. The source of this switch cost and the contribution of cognitive control to its resolution remain highly controversial. Here, we tested whether proactive interference arising from memory places fundamental constraints on flexible performance, and whether prefrontal control processes contribute to overcoming these constraints. Event-related functional MRI indexed neural responses during TS. The contributions of cognitive control and interference were made theoretically explicit in a computational model of task performance. Model estimates of two levels of proactive interference, "conceptual conflict" and "response conflict," produced distinct preparation-related profiles. Left ventrolateral prefrontal cortical activation paralleled model estimates of conceptual conflict, dissociating from that in left inferior parietal cortex, which paralleled model estimates of response conflict. These computationally informed neural measures specify retrieved conceptual representations as a source of conflict during TS and suggest that left ventrolateral prefrontal cortex resolves this conflict to facilitate flexible performance.


Conflict of interest statement

Conflict of interest statement: No conflicts declared.

Figures

Fig. 1
Fig. 1
Schematic depicting events during Experiments 1 and 2. (A) During Experiment 1, the pretarget portion of the trial began with a variable RCI, over which only passive decay could occur, followed by a task cue (LETTER or NUMBER), and then a CSI during which active preparation could also occur. Then a number–letter target was presented until the subject made their response. (B) In Experiment 2, task events consisted of a task cue, a CSI, and a target. Task events were grouped into sets of an initial event (T-1), during which experimental variables were held constant, and a second event (T-2), during which the experimental factors were manipulated. For fMRI analysis, each set was coded as an epoch starting at the onset of the T-1 cue; these epochs could be readily compared because, across the T-2 experimental conditions, the epoch history was identical up to presentation of the T-2 cue.
Fig. 2
Fig. 2
Results from Experiment 1 and CAM-TS simulations. (A) CAM-TS consists of layers of task, conceptual, and response units connected by feedforward and feedback associations. The switch vs. repeat difference in conflict computed from the model's concept layer (red) declined over CSI, whereas the difference in conflict computed from the response layer (blue) roughly increased over increasing CSI. (B) Declines in RT switch cost from Experiment 1 are plotted along with simulated costs with and without control. (C) Simulated RT costs and RT switch cost from Experiment 1 split by RR.
Fig. 3
Fig. 3
Plots of RT and error rate from Experiment 2. (A) Depiction of differences between switch and repeat trials as a function of RR (RS vs. RD). (B) The linear decline in RT switch cost across CSI was reliable (P < 0.05), and there was a trend for a decline in error rates [t(9) = 1.9, P = 0.08].
Fig. 4
Fig. 4
fMRI results from Experiment 2. (A) Surface rendering of switch > repeat at the shortest CSI (250 ms). Plotted are neural switch costs across CSI from ROI analyses of left mid-VLPFC (−51 27 6) and posterior VLPFC (−45 6 27). (B) The contrast of switch vs. repeat collapsed across CSI. Plotted are changes in neural switch cost from ROIs in left mid-VLPFC (−54 33 18), inferior parietal cortex (−51 −33 48), and SMA (0 18 48). Also depicted are linearly scaled conflict signals (dashed lines) from conceptual (red) and response [blue (standard) and green (cumulative)] layers of CAM-TS. (C) Bar graphs depict enhancement of switch costs during RS vs. RD trials split by switch (red bar) and repeat (green bar) from ROIs in left mid-VLPFC (−54 33 18), inferior parietal cortex (−51 −33 48), and SMA (0 18 48).

Similar articles

Cited by

References

    1. Jersild A. T. Arch. Psychol. 1927;(no. 89)
    1. Allport A., Wylie G. In: Control of Cognitive Processes: Attention and Performance. Monsell S., Driver J., editors. Vol. XVIII. Cambridge, MA: MIT Press; 2000. pp. 35–70.
    1. Rubinstein J. S., Meyer D. E., Evans J. E. J. Exp. Psychol. Hum. Percept. Perform. 2001;27:763–797. - PubMed
    1. Monsell S. Trends Cognit. Sci. 2003;7:134–140. - PubMed
    1. Logan G. D. Curr. Direct. Psychol. Sci. 2003;12:45–48.

Publication types