. 2006 Jun;18(6):1339-47.
doi: 10.1105/tpc.105.040535. Epub 2006 Apr 21.

Sequence-level analysis of the diploidization process in the triplicated FLOWERING LOCUS C region of Brassica rapa

Affiliations

Sequence-level analysis of the diploidization process in the triplicated FLOWERING LOCUS C region of Brassica rapa

Tae-Jin Yang et al. Plant Cell. 2006 Jun.

Abstract

Strong evidence exists for polyploidy having occurred during the evolution of the tribe Brassiceae. We show evidence for the dynamic and ongoing diploidization process by comparative analysis of the sequences of four paralogous Brassica rapa BAC clones and the homologous 124-kb segment of Arabidopsis thaliana chromosome 5. We estimated the times since divergence of the paralogous and homologous lineages. The three paralogous subgenomes of B. rapa triplicated 13 to 17 million years ago (MYA), very soon after the Arabidopsis and Brassica divergence occurred at 17 to 18 MYA. In addition, a pair of BACs represents a more recent segmental duplication, which occurred approximately 0.8 MYA, and provides an exception to the general expectation of three paralogous segments within the B. rapa genome. The Brassica genome segments show extensive interspersed gene loss relative to the inferred structure of the ancestral genome, whereas the Arabidopsis genome segment appears little changed. Representatives of all 32 genes in the Arabidopsis genome segment are represented in Brassica, but the hexaploid complement of 96 has been reduced to 54 in the three subgenomes, with compression of the genomic region lengths they occupy to between 52 and 110 kb. The gene content of the recently duplicated B. rapa genome segments is identical, but intergenic sequences differ.


Figures

Figure 1.
Figure 1.
Selection and Chromosomal Allocation of the BAC Clones Containing FLC Paralogs. (A) DNA gel blot hybridization with the FLC gene on the HindIII fingerprint of the FLC-positive BAC clones. Red letters a, b, c, d, and e indicate B. rapa BAC clones, 52O08, 117M18, 4D11, 80A08, and 80C09, respectively. (B) Metaphase FISH using 52O08. Pachytene FISH using 52O08 (red) and 117M18 (green) is highlighted in the inset. (C) Metaphase FISH using 4D11 (red) and 80C09 (green). (D) Metaphase FISH using 80A08 (green) and the chromosome 10–specific BAC clone KBrH053G06 (red). (E) The relative positions of the five BAC clones are denoted as blue ovals on the cytogenetically defined chromosomes (Lim et al., 2005). Chr. and LG indicate cytogenetic chromosome numbers and their linkage group numbers. Chromosomes of B. rapa are represented as a cartoon based on centromere position (constriction) and major repeat sequences: centromeric repeats (red); 45S rDNA (green); 5S rDNA (magenta); and other pericentromeric heterochromatin (black). FLC homologs are denoted in parentheses near the BAC clones based on the genetic map and similarity to genes reported previously (Schranz et al., 2002).
Figure 2.
Figure 2.
Comparative Map of the Five B. rapa BAC Clones and Their Counterparts in Arabidopsis. Sequence-based genetic mapping was conducted to localize five BAC clones on the reference map of B. rapa using simple sequence repeat markers and adjacent EST markers (Suwabe et al., 2002; Lowe et al., 2004; J.S. Kim, T.Y. Chung, G.J. King, M. Jin, T.J. Yang, Y.M. Jin, H.I. Kim, and B.S. Park, unpublished data). Double-headed arrows indicate the α duplication block in Arabidopsis (black), counterpart orthologous regions between Arabidopsis and B. rapa (blue and magenta), and a recent segmental duplication in B. rapa (red). The red boxes indicate B. rapa BACs.
Figure 3.
Figure 3.
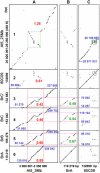
Dot-Plot Analyses of Seven Homologous Sequences. Dot plot of At5_3Mb (A), BrA (80A08) (B), and 80C09 (C) versus At5_25Mb (1), 80C09 (2), BrC′ (117M18) (3), BrC (52O08) (4), BrB (4D11) (5), and BrA (80A08) (6). The beginning and end points of collinear alignments are shown as black numerals. Common sequence in four BACs are indicated by red dotted lines. The relative collinearity indexes (collinear nucleotide of Brassica/Arabidopsis) are shown as red and green numerals. A large-scale inversion and an array of four small tandem duplications that differentiate At5_25Mb and 80C09 from the others are indicated by a green dotted box and a green circle, respectively. The green bars indicate the largest deletion (∼23 kb), which corresponds to 3,234,901 to 3,258,580 bp of Arabidopsis chromosome 5.
Figure 4.
Figure 4.
Schematic Representation of Sequence Conservation between At5_3Mb and Its Four Orthologous Blocks in B. rapa. (A) Summarized percentage identity plot of 124 kb from At5_3Mb (chromosome 5: 3,134,987 to 3,258,842) and the collinear sequences in four orthologous B. rapa BACs: 110 kb (1 to 110,219) from BrA; 74 kb (15,001 to 89,318) from BrB; 57 kb (58,254 to 115,292) from BrC; and 52 kb (18,227 to 70,502) from BrC′ (the red dotted area in Figure 3). The 36 genes of At5_3Mb (At5g10020 to At5g10360) are labeled A to Z and a to j, with colored arrows below indicating frequency in the triplicate blocks of B. rapa: green arrows (three paralogs), blue arrows (two paralogs), orange arrows (one paralog), and red arrows (none; the putative insertion). Gene Ontology (GO Slim) categories are shown in parentheses: UN (molecular function unknown); OB (other binding activity); PB (protein binding); HA (hydrolase activity); KA (kinase activity); EA (other enzyme activity); OM (other membrane activity); TR (transporter activity); TA (transferase activity); NB (nucleotide binding); TF (transcription factor activity); SM (structural molecule activity). The summarized percentage identity plot indicates the occurrence of homologous sequence in the frame of 124 kb of At5_3Mb, with collinear sequences from all four BACs (4BACs) and with a collinear sequence from each BAC. Red, green, and white blocks denote conserved, homologous, and nonhomologous sequences, respectively. Repeat denotes regions of low complexity (gray bars) and transposons (magenta bars) based on RepeatMasker results. (B) Comparative genome alignments based on discontinuous Megablast results between At5_3Mb and the collinear sequence of each BAC. The locations of predicted genes are indicated with colored arrows and labels as in (A). Genes with major changes are denoted as diamonds for a chimera of two adjacent genes, asterisks for deletion of >50% of exons, and triangles for insertion. Nonhomologous genes (putative insertions) are denoted as red arrows. Supporting data and full annotation of genes are available in Supplemental Figure 1 and Supplemental Table 1 online.
Figure 5.
Figure 5.
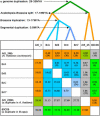
Chronology of Evolutionary Events and Ks Estimates for Homologous Genes in Duplication Blocks. Calculated divergence times in millions of years are shown below the self-comparison diagonal (T = Ks/2 × synonymous mutation rate per year [1.4 × 10⁻⁸] [Koch et al., 2000]). Median Ks values are shown above the self-comparison diagonal. Colored boxes represent different evolutionary events: the α genome duplication in A. thaliana (dark green); the α genome duplication in B. rapa (light green); ArabidopsisBrassica divergence (orange); genome triplication in B. rapa (dark blue); segmental duplication in B. rapa (light blue); and comparison between paralogous blocks across species (gray). Numbers in parentheses indicate the number of genes compared between two blocks. All Ks values based on pairwise comparisons of homologous genes are shown in Supplemental Table 2 online. Ks values between tandemly duplicated genes in duplication blocks, such as At5g10220 and At5g10230, are shown in Supplemental Figure 2 and Supplemental Table 3 online.

Similar articles

Cited by

References

    1. Arabidopsis Genome Initiative (2000). Analysis of the genome sequence of the flowering plant Arabidopsis thaliana. Nature 408 796–815. - PubMed
    1. Ayele, M., Haas, B.J., Kumar, N., Wu, H., Xiao, Y., Van Aken, S., Utterback, T.R., Wortman, J.R., White, O.R., and Town, C.D. (2005). Whole genome shotgun sequencing of Brassica oleracea and its application to gene discovery and annotation in Arabidopsis. Genome Res. 15 487–495. - PMC - PubMed
    1. Babula, D., Kaczmarek, M., Barakat, A., Delseny, M., Quiros, C.F., and Sadowski, J. (2003). Chromosomal mapping of Brassica oleracea based on ESTs from Arabidopsis thaliana: Complexity of the comparative map. Mol. Genet. Genomics 268 656–665. - PubMed
    1. Bennetzen, J.L. (2000). Transposable element contributions to plant gene and genome evolution. Plant Mol. Biol. 42 251–269. - PubMed
    1. Blanc, G., Hokamp, K., and Wolfe, K.H. (2003). A recent polyploidy superimposed on older large-scale duplications in the Arabidopsis genome. Genome Res. 13 137–144. - PMC - PubMed

Publication types

Substances

LinkOut - more resources