Comparative Study
. 2006 May;9(5):697-702.
doi: 10.1038/nn1693. Epub 2006 Apr 23.

End stopping in V1 is sensitive to contrast

Affiliations
Comparative Study

End stopping in V1 is sensitive to contrast

Arash Yazdanbakhsh et al. Nat Neurosci. 2006 May.

Abstract

Common situations that result in different perceptions of grouping and border ownership, such as shadows and occlusion, have distinct sign-of-contrast relationships at their edge-crossing junctions. Here we report a property of end stopping in V1 that distinguishes among different sign-of-contrast situations, thereby obviating the need for explicit junction detectors. We show that the inhibitory effect of the end zones in end-stopped cells is highly selective for the relative sign of contrast between the central activating stimulus and stimuli presented at the end zones. Conversely, the facilitatory effect of end zones in length-summing cells is not selective for the relative sign of contrast between the central activating stimulus and stimuli presented at the end zones. This finding indicates that end stopping belongs in the category of cortical computations that are selective for sign of contrast, such as direction selectivity and disparity selectivity, but length summation does not.


Figures

Figure 1
Figure 1
Sign of contrast along contour discontinuities drives border ownership and surface stratification. (a) Stable transparency with a transparent square appearing to lie above the bar; the sign of contrast is preserved along the edges of the bar but reverses along the square. (b) Stable transparency with a transparent bar appearing to lie above the square; the sign of contrast is preserved along the edges of the square but reverses along the bar. (c) Bistable transparency or shadow; the sign of contrast is preserved along the length of the bar and along the orthogonal sides of the square. (d) The contrast of the bar with the background reverses sign along the length of the contour; the bar does not look like a single continuous object, but rather as three segmented pieces. Does sign-of-contrast order sufficiently predict the perception? (e) A counterexample of sufficiency: the contrast reverses along the length of the bar, but this time the configuration is consistent with the perception of an occluding bar. Although the sign of contrast along the orientation of the bar is not sufficient to differentiate the grouping uniquely, when this information is combined with the orthogonal-edge signs of contrast, the three conditions in c-e are distinguishable. Thus, determination of the contrast relationships along contours that make up junctions must be a necessary step towards the grouping solution. (f) The square appears over the bar and shows neon spreading of luminance into the bar; the contrast along the bar is preserved. (g) Reversal of luminance in f; the bar now appears on top and the contrast along the bar reverses with no neon spreading. (h) Classical version of a; unambiguous transparency configuration. (i) Classical version of c; ambiguous transparency configuration. (j) Classical version of d; unrealistic configuration. (k) Illusory border version of f analogously shows bleeding of the square onto the background in the same way that the square in f bleeds onto the bar. (l) Amodal completion version of g analogously shows no bleeding; in the same way that the bar in g occludes the square, the background here appears to occlude an underlying dark square seen through four holes.
Figure 2
Figure 2
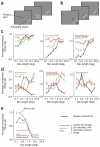
Sign-of-contrast selectivity of end stopping and length summation. (a) Stimulus configuration for classifying cells as length summing or end stopped. The stimulus was a plain black or white moving bar. (b) Stimulus configuration for determining sign-of-contrast selectivity of end-zone effects. The stimulus was a black or white moving bar with opposite-contrast wings. (c) Sign-of-contrast selectivity of length summation. Black curves indicate average normalized responses to a single-contrast bar moving back and forth across the receptive field (as in a) as a function of bar length, averaged for plain black and plain white bars. Colored lines show responses to a center bar of fixed length, as indicated, with opposite-contrast bilateral wings as a function of wing length; responses are averaged for white-center/black-wings bars and their reverse. (d) Sign-of-contrast selectivity of end stopping. Conventions as in c. (e) Interocular transfer properties of end-stopping interactions for a typical end-stopped cell. Blue trace shows the average of the monocular length-summation curves for the two eyes; other traces show responses to a central monocular bar, of the indicated length, as a function of wing length presented monocularly to the opposite eye, averaged over both eye combinations.
Figure 3
Figure 3
Population results for the end-zone properties of end-stopped and length-summing cells. End-stopped cells (left) show suppressive interactions for same-contrast end-zone stimulation and facilitatory effects for opposite-contrast end-zone stimulation. These properties are distinct from those of length-summing cells (right), which show facilitatory effects for both same- and opposite-contrast end-zone stimulation.
Figure 4
Figure 4
Stimulus configuration for sparse-noise reverse-correlation mapping of end-stopped and length-summing effects. In each frame, two white bars and two black bars were presented at random locations within a square stimulus range larger than the receptive field. The luminance of the bars was gamma-corrected; thus, the overlap of a back and a white bar canceled to background gray, and that of two black or two white bars resulted in a linear summation of whiter or darker luminance. For opposite-contrast interactions, spikes were reverse-correlated with all possible permutations of one black and one white bar and the resultant maps were averaged together. For the same-contrast maps, the same was done with all possible permutations of one white (or black) bar and the other white (or black) bar.
Figure 5
Figure 5
Paired-bar interaction maps for three end-stopped cells. Each row shows data for one cell. Direction tuning to moving bars is shown on the left; the optimal orientation is orthogonal to the preferred direction (dotted lines on the map). The interaction maps show the difference in response due to stimulus pairing as a function of distance between two bars when the two bars were of the same or opposite contrast, as indicated. Interactions are normalized to the maximum interaction for each cell. At reverse-correlation delays of 130 ms, the end zones are suppressive (blue) for same-contrast pairs and facilitatory (red) for opposite-contrast pairs. The sample bars at the center of each map show the scaled size and orientation of the bars used for stimuli. Dotted lines indicate the preferred orientation axis, on which end zones are centered.
Figure 6
Figure 6
Paired-bar interaction maps for three length-summing cells. Note that at reverse-correlation delays of 130 ms, the end zones are facilitatory (or at least not suppressive) for both same-contrast pairs and opposite-contrast pairs. At a delay of 130 ms, side-band interactions of length-summing cells show more variability, particularly for opposite-contrast bars. Conventions as in Figure 5.
Figure 7
Figure 7
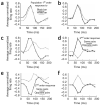
Time courses of first-order responses and second-order interactions in the end zones and the side bands. (a,c,e) End-stopped cells; (b,d,f) length-summing cells. (a,b) First-order responses to black or white bars presented at the center of the receptive field. Gray lines represent population-average responses to white stimuli; black lines represent responses to black stimuli. (c,d) End-zone interactions. (e,f) Side-band interactions. Black lines represent population-average second-order interactions between same-contrast stimulus pairs; gray lines represent interactions between opposite-contrast pairs.

Similar articles

Cited by

References

    1. Adelson EH. Lightness perception and lightness illusions. In: Gazzaniga M, editor. The New Cognitive Neurosciences. MIT Press; Cambridge, MA: 2000. pp. 339–351.
    1. Attneave F. Some informational aspects of visual perception. Psychol. Rev. 1954;61:183–193. - PubMed
    1. Beck J, Prazdny K, Ivry R. The perception of transparency with achromatic colors. Percept. Psychophys. 1984;35:407–422. - PubMed
    1. Watanabe T, Cavanagh P. The role of transparency in perceptual grouping and pattern recognition. Perception. 1992;21:133–139. - PubMed
    1. Watanabe T, Cavanagh P. Transparent surfaces defined by implicit X junctions. Vision Res. 1993;33:2339–2346. - PubMed

Publication types