. 2006 May 2;45(17):5430-9.
doi: 10.1021/bi0525775.

Proton movement and photointermediate kinetics in rhodopsin mutants

Affiliations

Proton movement and photointermediate kinetics in rhodopsin mutants

James W Lewis et al. Biochemistry. .

Abstract

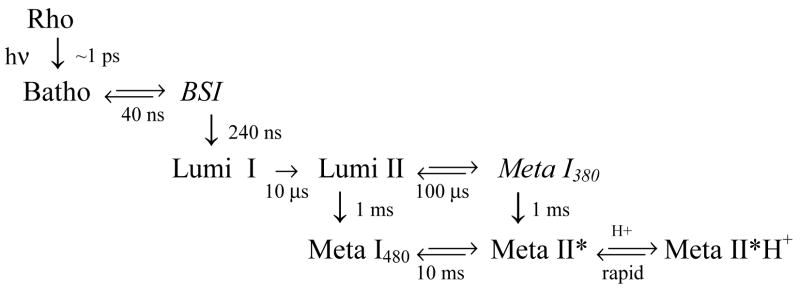
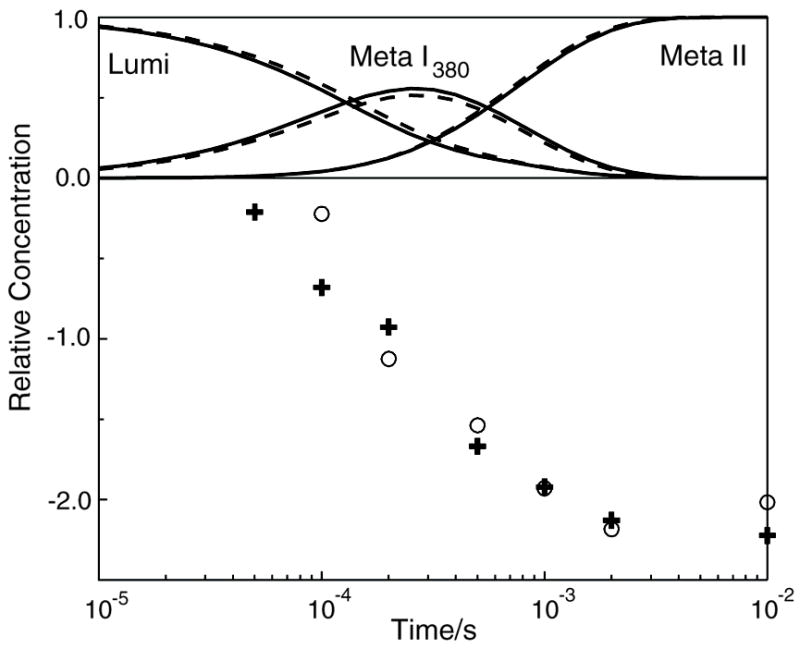
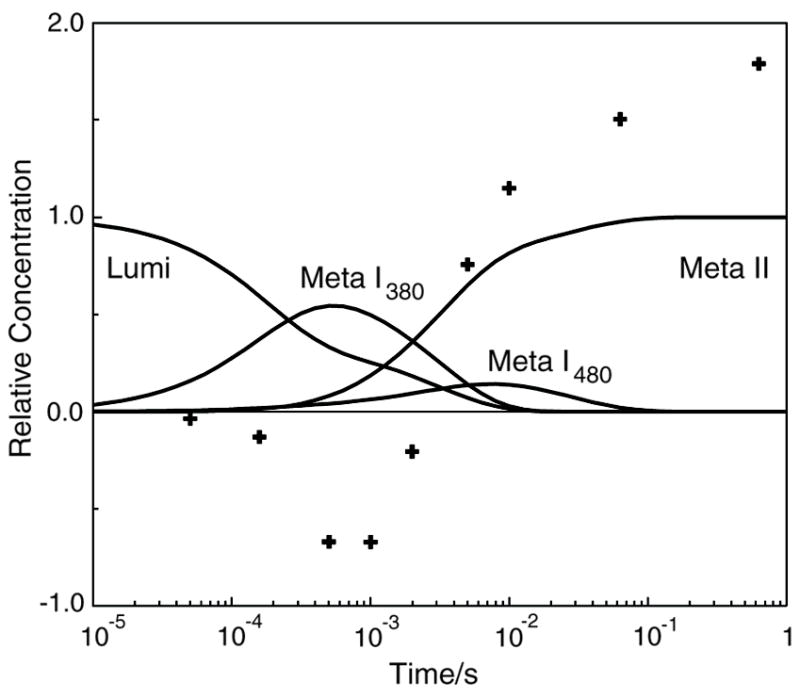
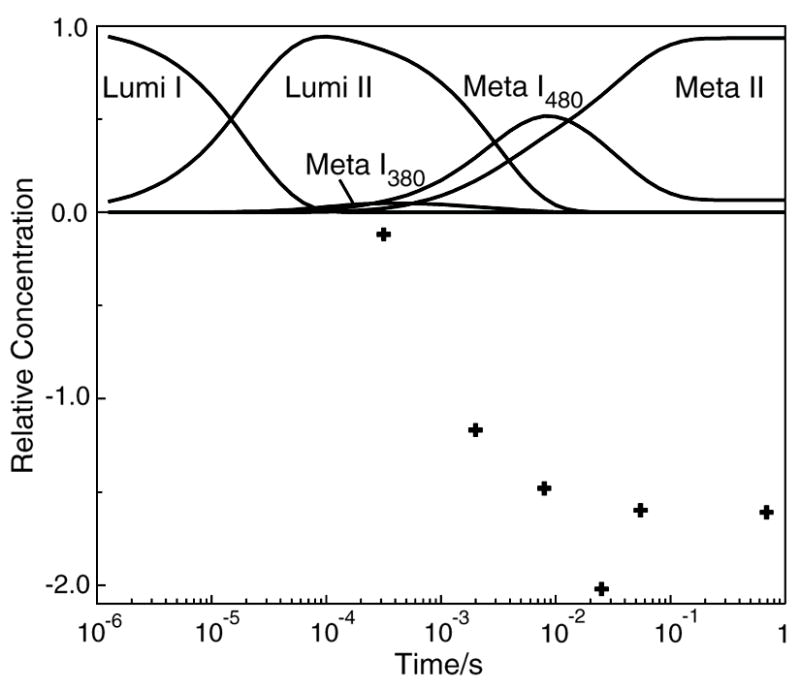
The role of ionizable amino acid side chains in the bovine rhodopsin activation mechanism was studied in mutants E134Q, E134R/R135E, H211F, and E122Q. All mutants exhibited bathorhodopsin stability on the 30 ns to 1 micros time scale similar to that of the wild type. Lumirhodopsin decay was also similar to that of the wild type except for the H211F mutant where early decay (20 micros) to a second form of lumirhodopsin was seen, followed by formation of an extremely long-lived Meta I(480) product (34 ms), an intermediate which forms to a much reduced extent, if at all, in dodecyl maltoside suspensions of wild-type rhodopsin. A smaller amount of a similar long-lived Meta I(480) product was seen after photolysis of E122Q, but E134Q and E134R/R135Q displayed kinetics much more similar to those of the wild type under these conditions (i.e., no Meta I(480) product). These results support the idea that specific interaction of His211 and Glu122 plays a significant role in deprotonation of the retinylidene Schiff base and receptor activation. Proton uptake measurements using bromcresol purple showed that E122Q was qualitatively similar to wild-type rhodopsin, with at least one proton being released during lumirhodopsin decay per Meta I(380) intermediate formed, followed by uptake of at least two protons per rhodopsin bleached on a time scale of tens of milliseconds. Different results were obtained for H211F, E134Q, and E134R/R135E, which all released approximately two protons per rhodopsin bleached. These results show that several ionizable groups besides the Schiff base imine are affected by the structural changes involved in rhodopsin activation. At least two proton uptake groups and probably at least one proton release group in addition to the Schiff base are present in rhodopsin.


Figures

Figure 1
Figure 1
Rhodopsin bleaching sequence near physiological temperatures in membrane. Some of the intermediates can be trapped after low-temperature photolysis, but those shown in italics, BSI (whose equilibrated mixture with Batho is sometimes called BL) and Meta I380, only build up appreciable concentrations near physiological temperatures (15, 23, 34). The time constants given are appropriate for membrane suspensions of rhodopsin near 20 °C. This general scheme also holds for detergent samples (such as DM) with the same time constants up to Lumi II formation. However, DM forward shifts both the Lumi II ⇄ Meta I380 and the Meta I480 ⇄ Meta II* equilibria so that little or no Meta I480 appears at high DM to rhodopsin ratios. Because the two Meta II forms are isochromic, their equilibrated mixture was originally referred to as metarhodopsin II. Meta II* is also called MIIa and it should be distinguished from the G protein activating form R*, also called MIIb.
Figure 2
Figure 2
Photointermediate kinetics and proton release in the E134R/R135E mutant of rhodopsin. The upper left panel shows the time-resolved absorbance changes observed after photolysis. Data was collected at (heavy lines) 30, 60, 120, 240, 400, 1000ns (fine lines), 10, 30, 50, 100, 150, 200, 300, 400, 800 μs, 2 and 10 ms. The increase in absorbance at 30 ns, peaking near 560 nm, is due to formation of the Batho intermediate. The increase in absorbance at 380 nm developing at the longer times is due to the final photointermediate on this time scale, Meta II. The negative absorbance change at long times near 500 nm is due to the disappearance of the pigment absorbance (and other protonated Schiff base intermediates) after photolysis. The spectral changes seen in this mutant are essentially identical to those seen after photolysis of a wild type rhodopsin sample solubilized in detergents such as dodecyl maltoside (15,20). The b-spectra obtained from the E135R/R135E mutant are presented in the upper right panel and show the spectral changes associated with each exponential time constant as determined from the global exponential fitting process (see text), and the b-spectrum labeled 0 is the time independent spectral change seen here. Points in the figure give the experimental b-spectra, and the smooth curves show the fit to the data using microscopic rate constants and model intermediate spectra determined from fitting. The observed lifetimes associated with the time dependent components (1, 2, 4 and 5) are given in Table 1. The quality of the fit to these four exponentials is shown by the residuals (difference between the actual data and fit computed using the time constants and b-spectra) plotted in the lower right panel (traces have been offset by 0.005 AU, shortest time delay is at bottom). The lower left panel shows time resolved absorbance changes seen at late times in the presence of BCP. Delay times shown are 50, 100, 200, 500 μs, 1, 2, and 10 ms. At these times, long after Batho has disappeared, the changes in the red, near 595 nm, are due to disappearance of the deprotonated form of BCP at late times (i.e. proton release by rhodopsin). The protonation changes in E134R/R135E are the opposite of what is observed under these conditions in wild type rhodopsin. For comparison of kinetics with other mutants, the 2 ms time-resolved absorbance spectra are shown as dashed lines.
Figure 3
Figure 3
Time dependence of the concentration of photointermediates and proton release seen after photolysis of rhodopsin mutants E134R/R135E and E134Q. Curves (solid, E134R/R135E; dashed, E134Q) show the relative concentration of photointermediates that appear after photolysis, and points (+, E134R/R135E; o, E134Q) show proton changes associated with the pigments after photolysis (proton release signal at 690 ms was the same as at 10 ms, data not shown). Although the concentrations of E134R/R135E and E134Q photointermediates have time dependence very similar to those observed for wild type rhodopsin, in these mutants only proton release by the protein is seen (rather than the uptake seen for wild type rhodopsin).
Figure 4
Figure 4
Photointermediate kinetics and proton release/uptake in the E122Q and H211F mutants of rhodopsin. The upper left panel shows the time-resolved absorbance changes observed after photolysis of E122Q. Data were collected at (heavy lines) 30, 90ns, (fine lines)1, 10, 50, 150, 300, 800 μs, 2, 10, 60 and 690 ms. The kinetics of Schiff base deprotonation seen after photolysis of E122Q showed significant slowing relative to wild type rhodopsin under these conditions. This is demonstrated by the time constants given in Table 1 associated with the b-spectra shown in the lower left panel (b-spectrum associated with Batho decay not shown). Time-resolved difference spectra that were collected from E122Q in the presence of BCP at delay times (fine lines) 50, 150, 450 μs, 1, 2, 5, 10, 60 and (heavy line) 690 ms are shown in the left, middle panel. For E122Q, early proton release (bleaching near 595 nm at 450 μs) followed by net proton uptake (absorbance peaking near 595 nm at 690 ms) was seen which is qualitatively similar behavior to wild type rhodopsin. The upper right panel shows the time-resolved absorbance changes observed after photolysis of H211F. Data was collected at (heavy lines) 30, 90ns, (fine lines)1, 10, 50, 300 μs, 2, 10, 30, 60 and 690 ms. The kinetics of Schiff base deprotonation seen after photolysis of H211F showed much greater slowing relative to wild type rhodopsin under these conditions than do those of E122Q. As is shown by the b-spectra in the lower right panel, for H211F the slowest component (6) which was small for E122Q and does not occur in detergent solubilized wild type rhodopsin, is the largest amplitude b-spectrum (b-spectrum associated with Batho decay not shown). In the middle, right panel time-resolved difference spectra are shown that were collected from H211F in the presence of BCP at delay times 300 μs, 2, 8, 25, 55 and 690 ms. For H211F, similarly to E135R/R135E and E134Q (data not shown) only proton release is seen. For comparison of kinetics, the 2 ms time-resolved absorbance spectra are shown as dashed lines.
Figure 5
Figure 5
Time dependence of the concentration of photointermediates and proton release seen after photolysis of rhodopsin mutant E122Q. Curves show the relative concentration of photointermediates that appear after photolysis and points (+) show proton changes associated with the pigment after photolysis. The proton uptake data show release of at least one proton per photolyzed rhodopsin at the Meta I380 stage followed by more than 1 proton per rhodopsin uptake at Meta II.
Figure 6
Figure 6
Time dependence of the concentration of photointermediates and proton release seen after photolysis of rhodopsin mutant H211F. Curves show the relative concentration of photointermediates that appear after photolysis and points (+) show proton changes associated with the pigment after photolysis. The formation of large amounts of Meta I480 seen on the time scale of 10’s of milliseconds, is an unusual feature of this mutant. At longer times, it also displays proton release in contrast to the behavior of wild type rhodopsin.
Figure 7
Figure 7
Mechanistic schemes deduced for rhodopsin mutants. Data were analyzed in terms of the square scheme which describes rhodopsin in membrane suspensions. Normally, in detergent suspensions of rhodopsin, the Meta I480 photointermediate does not appear (behaving similarly to the scheme deduced here for E134R/R135E and E134Q). However, in E122Q and H211F the fuller form of the scheme prevails, as it does in membrane suspensions of rhodopsin. At temperatures below 20°C in membrane suspensions, no Meta I380 appears, similarly to what is seen for H211F here.
Figure 8
Figure 8
Blue shift of rhodopsin mutant photointermediates relative to rhodopsin’s λmax (498 nm). The blue shift of the λmax values of rhodopsin’s photointermediate are indicated by “wt” in the plot, and since Meta I480 does not appear to any significant degree in DM suspensions of rhodopsin, the value of its blue shift obtained in membrane suspensions is denoted here as “wt”. Where no Lumi I - Lumi II transition was detected (E122Q, E134R/R135E and E134Q), only the undifferentiated Lumi photointermediate’s blue shift is plotted. Changes in the size of the labels denotes changes in the plotted photointermediate’s extinction coefficient. Notable here is that mutation of either Glu122 or His211 produces a large blue shift of the Lumi intermediate which persists in Meta I480.
Figure 9
Figure 9
Hydrogen bonds involving side chains of Glu122 and His211. Fragments of rhodopsin helices 3 (red), 4 (orange) and 5 (yellow) are shown in relationship to the retinylidene chromophore (green). Shown by dotted lines are hydrogen bonds proposed to exist from Glu122 to the backbone carbonyl of His211 (2.8 Å) and to the side chain of Trp126 (3.1 Å). Also shown by a dotted line is the proposed rhodopsin hydrogen bond from the side chain of His211 to the hydroxyl of Tyr206 (2.9 Å). The distance from the hydroxyl of Tyr206 to the non-helical backbone carbonyl of Ala166 (2.6 Å) is shown by a solid line. Note that if His211 is unprotonated, Tyr206 can participate in only one of these potential hydrogen bonds. Also of interest is that the distance from His211 to Trp126 (3.3 Å) is only slightly greater than from Glu122. The coordinates used to generate this view were derived from molecule A of Li 3 et al. (5).

Similar articles

Cited by

References

    1. Vogel R, Siebert F. Fourier transform IR spectroscopy study for new insights into molecular properties and activation mechanisms of visual pigment rhodopsin. Biopolymers. 2003;72:133–148. - PubMed
    1. Pan DH, Mathies RA. Chromophore structure in lumirhodopsin and metarhodopsin I by time-resolved resonance Raman microchip spectroscopy. Biochemistry. 2001;40:7929–7936. - PMC - PubMed
    1. Pan DH, Ganim Z, Kim JE, Verhoeven MA, Lugtenburg J, Mathies RA. Time-resolved resonance Raman analysis of chromophore structural changes in the formation and decay of rhodopsin’s BSI intermediate. J Am Chem Soc. 2002;124:4857–4864. - PMC - PubMed
    1. Okada T, Sugihara M, Bondar AN, Elstner M, Entel P, Buss V. The retinal conformation and its environment in rhodopsin in light of a new 2.2 angstrom crystal structure. J Mol Biol. 2004;342:571–583. - PubMed
    1. Li J, Edwards PC, Burghammer M, Villa C, Schertler GFX. Structure of bovine rhodopsin in a trigonal crystal form. J Mol Biol. 2004;343:1409–1438. - PubMed

Publication types