

Evolution of resistance during clonal expansion
- PMID: 16636113
- PMCID: PMC1456382
- DOI: 10.1534/genetics.105.049791
Evolution of resistance during clonal expansion
Abstract
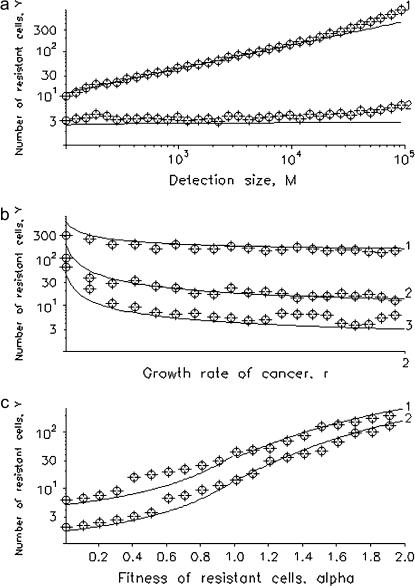
Acquired drug resistance is a major limitation for cancer therapy. Often, one genetic alteration suffices to confer resistance to an otherwise successful therapy. However, little is known about the dynamics of the emergence of resistant tumor cells. In this article, we consider an exponentially growing population starting from one cancer cell that is sensitive to therapy. Sensitive cancer cells can mutate into resistant ones, which have relative fitness alpha prior to therapy. In the special case of no cell death, our model converges to the one investigated by Luria and Delbrück. We calculate the probability of resistance and the mean number of resistant cells once the cancer has reached detection size M. The probability of resistance is an increasing function of the detection size M times the mutation rate u. If Mu << 1, then the expected number of resistant cells in cancers with resistance is independent of the mutation rate u and increases with M in proportion to M(1-1/alpha) for advantageous mutants with relative fitness alpha>1, to l nM for neutral mutants (alpha = 1), but converges to an upper limit for deleterious mutants (alpha<1). Further, the probability of resistance and the average number of resistant cells increase with the number of cell divisions in the history of the tumor. Hence a tumor subject to high rates of apoptosis will show a higher incidence of resistance than expected on its detection size only.
Figures


References
-
- Bentires-Alj, M., V. Barbu, M. Fillet, A. Chariot, B. Relic et al., 2003. Nf-kb transcription factor induces drug resistance through mdr1 expression in cancer cells. Oncogene 22: 90–97. - PubMed
-
- Branford, S., Z. Rudzki, A. Grigg, J. F. Seymour, K. Taylor et al., 2003. The incidence of BCR-ABL kinase mutations in chronic myeloid leukemia patients is as high in the second year of imatinib therapy as the first but survival after mutation detection is significantly longer for patients with mutations detected in the second year of therapy. Blood 102: 414.
-
- Feller, W., 1971. Introduction to Probability Theory and Its Applications, Vol. II. John Wiley & Sons, New York.
-
- Frank, S. A., 2003. Somatic mosaicism and cancer: inference based on a conditional Luria-Delbrück distribution. J. Theor. Biol. 223: 405–412. - PubMed
Publication types
MeSH terms
Substances
Grants and funding
LinkOut - more resources
Full Text Sources
Other Literature Sources
Research Materials
