. 2006 May 15;203(5):1209-19.
doi: 10.1084/jem.20051911. Epub 2006 Apr 24.

NOD.c3c4 congenic mice develop autoimmune biliary disease that serologically and pathogenetically models human primary biliary cirrhosis

Affiliations

NOD.c3c4 congenic mice develop autoimmune biliary disease that serologically and pathogenetically models human primary biliary cirrhosis

Junichiro Irie et al. J Exp Med. .

Abstract

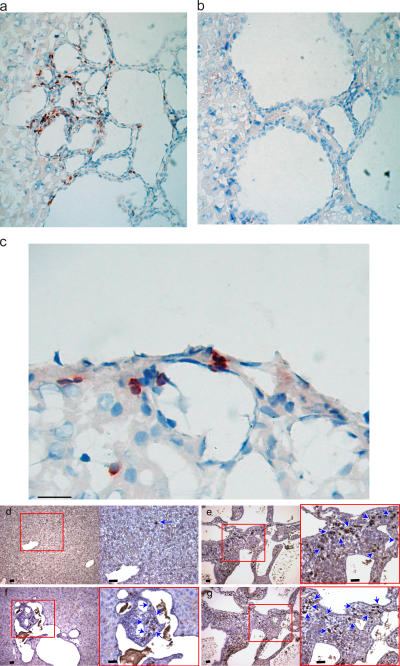
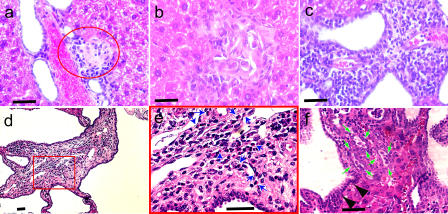
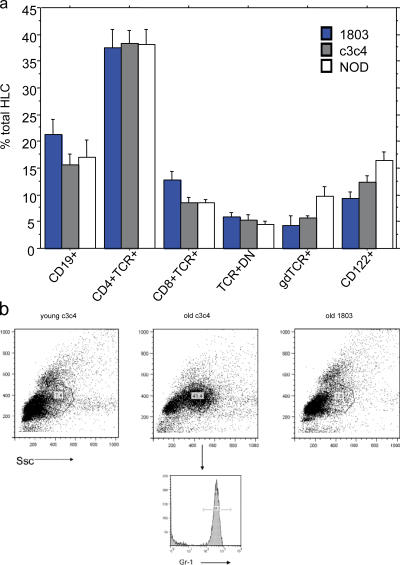
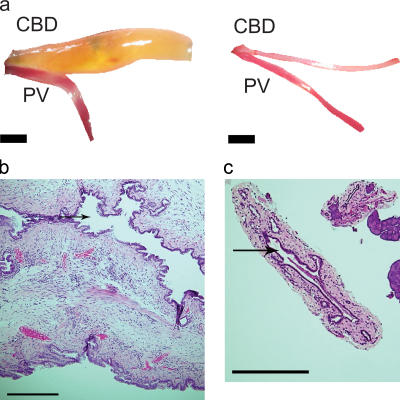
Primary biliary cirrhosis (PBC) is an autoimmune disease with a strong genetic component characterized by biliary ductular inflammation with eventual liver cirrhosis. The serologic hallmark of PBC is antimitochondrial antibodies that react with the pyruvate dehydrogenase complex, targeting the inner lipoyl domain of the E2 subunit (anti-PDC-E2). Herein we demonstrate that NOD.c3c4 mice congenically derived from the nonobese diabetic strain develop an autoimmune biliary disease (ABD) that models human PBC. NOD.c3c4 (at 9-10 wk, before significant biliary pathology) develop antibodies to PDC-E2 that are specific for the inner lipoyl domain. Affected areas of biliary epithelium are infiltrated with CD3+, CD4+, and CD8+ T cells, and treatment of NOD.c3c4 mice with monoclonal antibody to CD3 protects from ABD. Furthermore, NOD.c3c4-scid mice develop disease after adoptive transfer of splenocytes or CD4+ T cells, demonstrating a central role for T cells in pathogenesis. Histological analysis reveals destructive cholangitis, granuloma formation, and eosinophilic infiltration as seen in PBC, although, unlike PBC, the extrahepatic biliary ducts are also affected. Using a congenic mapping approach, we define the first ABD (Abd) locus, Abd1. These results identify the NOD.c3c4 mouse as the first spontaneous mouse model of PBC.


Figures

Figure 1.
Figure 1.
Genetic map of NOD.c3c4, 1803, and 1802 defining Abd1. Strain 1802 develops biliary disease, although at decreased penetrance compared with NOD.c3c4. Strain 1803 is free from ABD and differs from 1802 only on the upper portion of the chromosome 4 segment (labeled Abd1), which is distinct from the known chromosome 4 Idd regions.
Figure 2.
Figure 2.
Invasion by CD3+, CD4+, and CD8+ cells of NOD.c3c4 biliary epithelium. Immunohistochemistry using anti-CD3 (a) or isotype control antibody (b) on NOD.c3c4 liver sections, showing CD3+ cells (reddish-brown) directly adjacent to biliary epithelial cells in areas of cyst formation, but not adjacent to hepatocytes. (c) Magnified view showing CD3+ cells located directly adjacent to biliary epithelial cells (blue). (d) Control B6 liver showing lack of lymphocytic infiltrates, (e) immunohistochemical staining of CD4+ T cells infiltrating the peribiliary region, adjacent to cystic biliary changes, and (f) immunohistology of CD8+ mononuclear lymphoid cells in NOD.c3c4 mice. Note the presence of aggregated as well as dispersed CD8+ mononuclear cells (arrows) infiltrating the portal tracts. (g) Immunohistochemical staining of pDCA1+ dendritic cells in the peribiliary infiltrate. All bars, 50 μm.
Figure 3.
Figure 3.
Histological sections of (a–c) 20- and (d–f) 30-wk-old NOD.c3c4 mice livers showing lesions comparable to PBC. (a) Granulomatous lesion in a portal area, (b) chronic NSDC in portal area, and (c) peribiliary lymphoplasmacytic infiltration. Progression of the liver pathology in 30-wk-old NOD.c3c4 mice is shown by (d) pronounced biliary polycystic changes with infiltration of inflammatory cells, (e) fibrosis in the portal areas with eosinophilic infiltration (blue arrows), (f) hyperplasia of biliary epithelium with dilation of bile duct (black arrows) and degenerative biliary ductules with macrophage aggregates in the lumen (green arrows). All bars, 50 μm.
Figure 4.
Figure 4.
Cellular composition of the HLC population changes with age in NOD.c3c4, but not strain 1803, mice. (a) The NOD.c3c4 HLC population does not differ from that of NOD or 1803 mice before 30 wk of age. HLCs were isolated, stained with surface markers, lymphocyte gated, and analyzed by FACS (see Materials and methods) from NOD, 1803, and NOD.c3c4 mice. There was no significant difference in cell composition between NOD, NOD.c3c4, or 1803 mice (1803 NOD, n = 3–5; NOD.c3c4, n = 8–10, except in the case of γδT; NOD.c3c4, n = 4). All mice were 15–25 wk old. (b) Granulocyte accumulation in aged NOD.c3c4 mice. In NOD.c3c4 and 1803 >30 wk old, HLCs were isolated and analyzed by FACS as described above, using granulocyte gates (circled areas). Aged NOD.c3c4 showed a significantly increased accumulation of GR-1+ cells (41.4%) compared with aged 1803 mice (7.8%), which did not differ from young NOD.c3c4 mice (7.4%).
Figure 5.
Figure 5.
Differential cytokine production from HLCs and peripheral tissue lymphoid cells. (a) CD4+ cells were isolated from HLCs or peripheral lymphoid tissue (lymph node, spleen) and stimulated with anti-CD3/CD28 for 3 d before ribonuclease protection assay (see Materials and methods). Only HLC CD4+ T cells produced detectable amounts of IL-4, IL-5, IL-10, or IL-13. Data are representative of four separate experiments. (b) HLCs or peripheral lymphoid cells were stimulated for 3 d, and supernatants were collected and assayed for IL-4 production (see Materials and methods). Only HLCs produced substantial amounts of IL-4. The mean + SEM for multiple experiments is shown (LN and HLC, n = 4 experiments; spleen, n = 2). (c) CD4+ cells are the source of HLC cytokines. NOD.c3c4 HLCs were isolated as described above, purified into CD4+ and CD8+ cell fractions, and stimulated for 3 d, with anti-CD3/CD28 and supernatants collected for ELISA. Only the CD4+ fraction produced measurable amounts of IL-2 or IFN-γ. Data are representative of four separate experiments.
Figure 6.
Figure 6.
Anti-CD3 treatment of NOD.c3c4 mice ameliorates ABD and decreases the number of TCR+ CD69+ cells in the HLC population. Mice were treated with either a single dose of 200 μg anti-CD3 antibody in PBS or PBS alone between 6–10 wk of age, and HLC TCR+CD69+ cells were quantitated at ∼12 wk after treatment. A single dose of anti-CD3 antibody significantly reduced the number of TCR+CD69+ cells in the HLCs, but not in the spleen, compared with PBS-treated animals. Data shown are one representative of three separate experiments.
Figure 7.
Figure 7.
Dilated CBD is an early and specific indication of NOD.c3c4 biliary disease and reflects lymphocytic infiltration. (a) Substantially dilated CBDs (CBD) compared with the portal vein (PV) are found only in NOD.c3c4 mice (left) with liver disease, but not in NOD mice (right) or any other strains in absence of biliary disease. Bars, 1.5 mm. CBD and PV are shown digitally cropped from surrounding tissue. (b) Dilated NOD.c3c4 CBDs demonstrate lymphocytic infiltrates, tortuosity, and medial thickening (left). Anti-CD3 treatment (right) prevented histological abnormalities. Arrows point into the CBD lumen. Bars, 500 μm.
Figure 8.
Figure 8.
NOD.c3c4 mice develop anti–PDC-E2 antibodies at an early age. (a) Recombinant PDC-E2 was resolved by SDS-PAGE, transferred onto a nitrocellulose membrane, and probed with NOD.c3c4 sera (lanes 1 and 2); NOD.C3, NOD.C4, and NOD sera (lanes 3–5); and an mAb to PDC-E2 (lane 6), all at a 1:200 dilution. Reactivity was revealed by enhanced chemiluminescence (see Materials and methods). (b) Time course of NOD.c3c4 mice of anti–PDC-E2 and ANA reactivity from early age to 200 d. Significance according to Fisher's exact test.

Comment in

References

    1. Gershwin, M.E., A.A. Ansari, I.R. Mackay, Y. Nakanuma, A. Nishio, M.J. Rowley, and R.L. Coppel. 2000. Primary biliary cirrhosis: an orchestrated immune response against epithelial cells. Immunol. Rev. 174:210–225. - PubMed
    1. Coppel, R.L., L.J. McNeilage, C.D. Surh, J. Van de Water, T.W. Spithill, S. Whittingham, and M.E. Gershwin. 1988. Primary structure of the human M2 mitochondrial autoantigen of primary biliary cirrhosis: dihydrolipoamide acetyltransferase. Proc. Natl. Acad. Sci. USA. 85:7317–7321. - PMC - PubMed
    1. Gershwin, M.E., I.R. Mackay, A. Sturgess, and R.L. Coppel. 1987. Identification and specificity of a cDNA encoding the 70 kd mitochondrial antigen recognized in primary biliary cirrhosis. J. Immunol. 138:3525–3531. - PubMed
    1. Van de Water, J., M.E. Gershwin, P. Leung, A. Ansari, and R.L. Coppel. 1988. The autoepitope of the 74-kD mitochondrial autoantigen of primary biliary cirrhosis corresponds to the functional site of dihydrolipoamide acetyltransferase. J. Exp. Med. 167:1791–1799. - PMC - PubMed
    1. Van de Water, J., A.A. Ansari, C.D. Surh, R. Coppel, T. Roche, H. Bonkovsky, M. Kaplan, and M.E. Gershwin. 1991. Evidence for the targeting by 2-oxo-dehydrogenase enzymes in the T cell response of primary biliary cirrhosis. J. Immunol. 146:89–94. - PubMed

Publication types

MeSH terms