. 2006 May 15;203(5):1185-96.
doi: 10.1084/jem.20052398. Epub 2006 Apr 24.

A critical role for the host mediator macrophage migration inhibitory factor in the pathogenesis of malarial anemia

Affiliations

A critical role for the host mediator macrophage migration inhibitory factor in the pathogenesis of malarial anemia

Michael A McDevitt et al. J Exp Med. .

Erratum in

Abstract

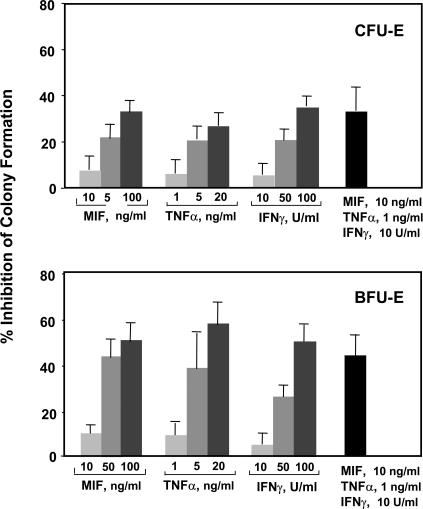
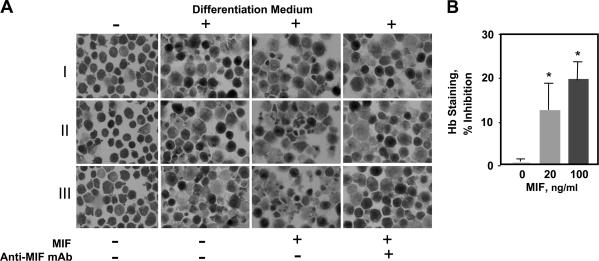
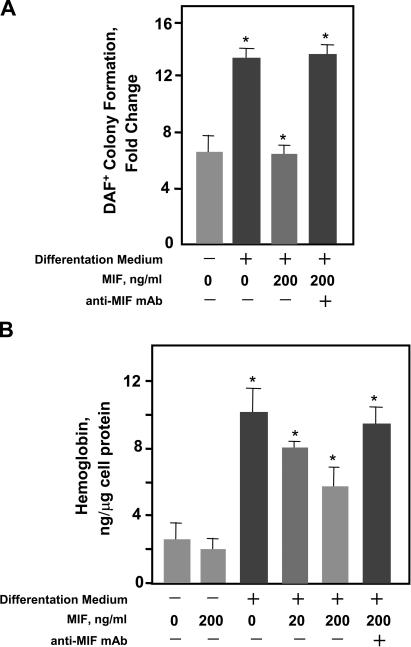
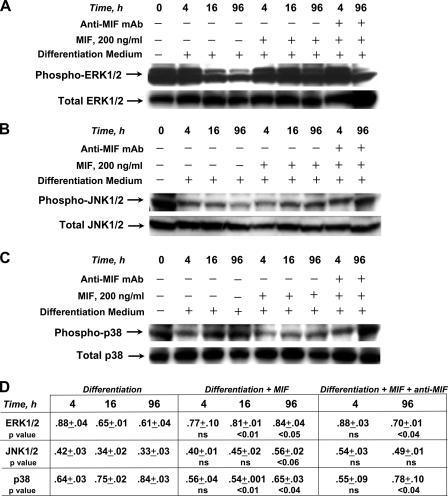
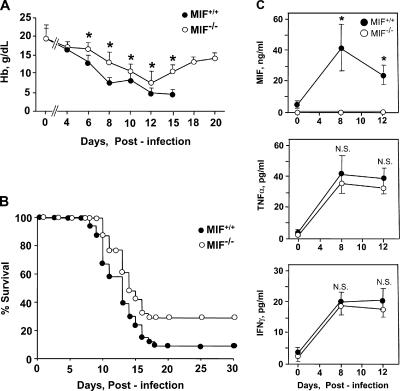
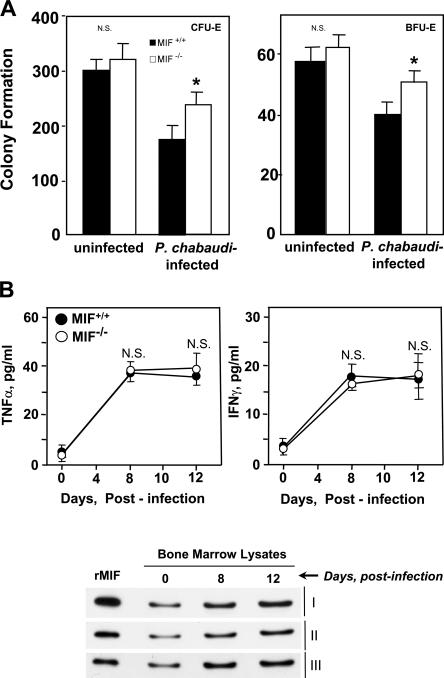
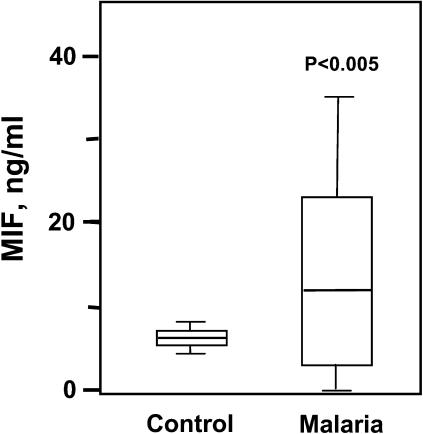
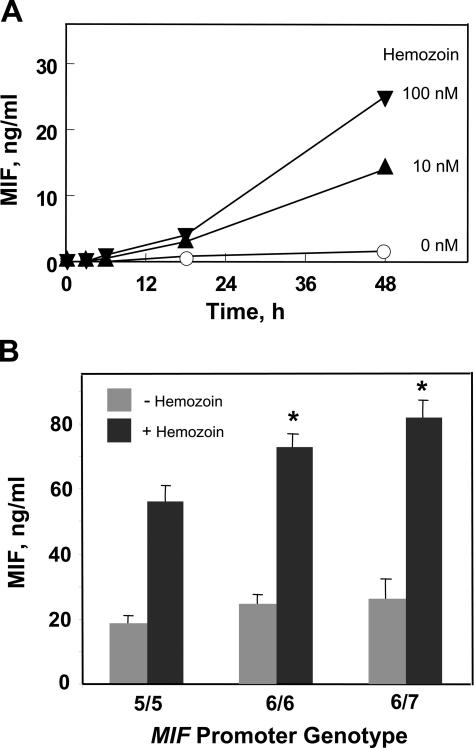
The pathogenesis of malarial anemia is multifactorial, and the mechanisms responsible for its high mortality are poorly understood. Studies indicate that host mediators produced during malaria infection may suppress erythroid progenitor development (Miller, K.L., J.C. Schooley, K.L. Smith, B. Kullgren, L.J. Mahlmann, and P.H. Silverman. 1989. Exp. Hematol. 17:379-385; Yap, G.S., and M.M. Stevenson. 1991. Ann. NY Acad. Sci. 628:279-281). We describe an intrinsic role for macrophage migration inhibitory factor (MIF) in the development of the anemic complications and bone marrow suppression that are associated with malaria infection. At concentrations found in the circulation of malaria-infected patients, MIF suppressed erythropoietin-dependent erythroid colony formation. MIF synergized with tumor necrosis factor and gamma interferon, which are known antagonists of hematopoiesis, even when these cytokines were present in subinhibitory concentrations. MIF inhibited erythroid differentiation and hemoglobin production, and it antagonized the pattern of mitogen-activated protein kinase phosphorylation that normally occurs during erythroid progenitor differentiation. Infection of MIF knockout mice with Plasmodium chabaudi resulted in less severe anemia, improved erythroid progenitor development, and increased survival compared with wild-type controls. We also found that human mononuclear cells carrying highly expressed MIF alleles produced more MIF when stimulated with the malarial product hemozoin compared with cells carrying low expression MIF alleles. These data suggest that polymorphisms at the MIF locus may influence the levels of MIF produced in the innate response to malaria infection and the likelihood of anemic complications.


Figures

Figure 1.
Figure 1.
Dose-dependent impact of MIF, TNFα, and IFNγ on colony formation in mouse bone marrow progenitor cultures in vitro. Bone marrow cells were harvested and plated in a methylcellulose-based medium, and colony numbers were scored after the addition of mouse cytokines (see Materials and methods). Individual assays were performed in duplicate, and the data shown is a compilation of three to six independently performed experiments. Percent inhibition of colony formation is calculated with reference to a cytokine-minus control. All values shown are the mean ± SD (error bars) and are significant when compared with wells with no cytokine addition (P < 0.05). CFU-E, CFU erythroid; BFU-E, burst-forming unit erythroid.
Figure 2.
Figure 2.
MIF inhibits cytodifferentiation and hemoglobin synthesis of MEL cells. (A) Photomicrographic images of benzidine-stained cells from three experiments (I, II, and III) cultured with or without differentiation medium for 96 h together with 200 ng/ml recombinant mouse MIF or MIF plus 100 μg/ml anti-MIF mAb. (B) Intracellular hemoglobin quantification of lysed MEL cells (4 × 10⁵ cells per experiment) as described in Materials and methods. Each value represents the mean ± SD (error bars) of five different experiments. *, P < 0.01 versus control.
Figure 3.
Figure 3.
MIF inhibits cytodifferentiation and hemoglobin production in human (K562) erythroid progenitors. (A) Terminal erythropoietic differentiation was assayed as described in Materials and methods with diaminofluorene (DAF) after culture in differentiation medium together with 200 ng/ml MIF for 96 h as described in Materials and methods. The neutralizing anti-MIF mAb was added at 100 μg/ml. DAF-positive cells were enumerated and expressed as fold change over total input cells. (B) Cellular hemoglobin content of cultured K562 progenitor cells. An isotypic control (IgG1) added in the same concentration had no impact on MIF's inhibitory action, nor did anti-MIF influence differentiation in the absence of MIF (not depicted). Each value represents the mean ± SD (error bars) of at least three different experiments. *, P < 0.01 versus corresponding controls.
Figure 4.
Figure 4.
Western blot analysis of the phosphorylation of MAP kinase proteins ERK-1/2, JNK-1/2, and p38 in response to cytodifferentiation and MIF treatment of K562 erythroid progenitors. For each experiment, 30 μg of cell lysates were subjected to SDS-gel electrophoresis and electroblotting followed by incubation with specific antiphospho–ERK-1/2 or total ERK (A), antiphospho–JNK-1/2 or total JNK antibodies (B), and antiphospho-p38 or total p38 antibodies (C). 100 μg/ml of neutralizing anti-MIF mAb showed no influence on MAP kinase activation in the absence of exogenously added MIF (not depicted). One representative blot is shown from at least three independently performed cell culture experiments for each kinase analysis. (D) Densitometric values were calculated as the ratio of phosphorylated to total MAP kinase as described in Materials and methods (n = 3 blots from independent experiments; mean ± SEM). Significance was calculated for each treatment condition (MIF or MIF + anti-MIF) versus nontreatment for each time point (, , and 96 h).
Figure 5.
Figure 5.
Malaria-infected MIF-KO mice (MIF−/−) suffer from less severe anemia and show increased survival when compared with genetically matched wild-type controls (MIF+/+). (A) Time course for the development of anemia as assessed by peripheral blood sampling every other day. The data shown are the means ± SD (error bars) of 10 mice per group from one of two experiments that yielded similar results. For differences in mean hemoglobin concentrations between the MIF+/+ and MIF−/− mice, P values are as follows: *, P < 0.01 for days 6, 8, and 15; *, P < 0.05 for days 10 and 12. Because of low numbers of survivors, the wild-type mice were not further studied after day 15. (B) Kaplan-Meyer survival curves for MIF+/+ and MIF−/− mice after infection with P. chabaudi AS. The data shown are for all mice studied (MIF+/+, n = 30; MIF−/−, n = 31). The median survival was 13 d for MIF+/+ mice and 15 d for MIF−/− mice. P = 0.0113 (two-tailed Mann-Whitney test); for overall survival, P < 0.04 (χ2 test). (C) Plasma MIF, TNFα, and IFNγ concentrations measured by ELISA in P. chabaudi–infected wild-type (MIF+/+) and MIF-KO (MIF−/−) mice. Cytokines were measured in triplicate. (The MIF-KO mice do not produce any immunoreactive MIF product). For TNFα and IFNγ, there were statistically significant increases on postinfection days 8 and 12 compared with uninfected controls in both strains (*, P < 0.001).
Figure 6.
Figure 6.
Malaria-infected MIF-KO mice show enhanced bone marrow erythroid progenitor maturation. (A) CFU-E and BFU-E formation in cultured bone marrow cells harvested from P. chabaudi–infected or uninfected mice on postinfection day 13. Colonies were scored as described in Materials and methods, and the data shown are the mean ± SD (error bars) of three mice per group. *, P < 0.01 for MIF−/− versus MIF+/+. (B) TNFα, IFNγ, and MIF production in bone marrow lysates obtained from P. chabaudi–infected wild-type (MIF+/+) and MIF-KO (MIF−/−) mice. TNFα and IFNγ were measured by ELISA, and the data shown are the mean ± SD for five mice per group. The time-dependent increase in bone marrow MIF content was assessed by Western blotting of bone marrow samples (240 ng of total protein per lane) as described in Materials and methods. The blots show the bone marrow analysis of three mice that were studied (I, II, and III). The standard lane (first) shows the immunoblotting intensity of 90 ng of recombinant mouse MIF protein.
Figure 7.
Figure 7.
Plasma MIF concentrations are elevated in malaria-infected individuals. MIF was quantified by sandwich ELISA in 20 sequentially diagnosed subjects with malaria presented to the Macha Mission Hospital in Zambia. Control plasmas (n = 20) were obtained contemporaneously from uninfected hospital controls. The bottom, middle, and top lines of the box mark the 25th, 50th, and 75th percentiles, respectively. The vertical line shows the range of values comprised between the 5th and 95th percentiles. The mean plasma MIF concentrations for the control and malaria groups were 5.4 and 13.6 ng/ml, respectively (P < 0.005 by a two-tailed Student's t test). Error bars represent SD.
Figure 8.
Figure 8.
Hemozoin-induced MIF release from mononuclear cells is regulated by low and high expression MIF alleles. (A) Hemozoin induces MIF release by cultured mouse macrophages. 2 × 10⁶/ml thioglycollate-elicited peritoneal macrophages were cultured with synthetically prepared hemozoin for the indicated times, and the conditioned medium was harvested for MIF ELISA. Values shown are the mean of triplicate determinations. (B) Hemozoin-stimulated human mononuclear cells encoding the high expression MIF alleles 6-CATT/6-CATT (6/6) or 6-CATT/7-CATT (6/7) release more MIF protein than cells encoding the low expression MIF allele 5-CATT/5-CATT (5/5). Cells were stimulated with 42 nM hemozoin for 48 h before sampling supernatants for MIF content. Values shown are mean ± SD (error bars) of duplicate analyses. *, P < 0.002 for 6/6 versus 5/5; *, P < 0.001 for 6/7 versus 5/5; *, P < 0.02 for 6/7 versus 6/6.

References

    1. Miller, L., D. Baruch, K. Marsh, and O. Doumbo. 2002. The pathogenic basis of malaria. Nature. 415:673–679. - PubMed
    1. Breman, J.G. 2001. The ears of the hippopotamus: manifestations, determinants, and the estimate of the malaria burden. Am. J. Trop. Med. Hyg. 64:S1–11. - PubMed
    1. Nagel, R. 2002. Malarial anemia. Hemoglobin. 26:329–343. - PubMed
    1. McDevitt, M., J. Xie, V. Gordeuk, and R. Bucala. 2004. The anemia of malaria infection: role of inflammatory cytokines. Curr. Hematol. Rep. 3:97–106. - PubMed
    1. Chang, K.-H., and M.M. Stevenson. 2004. Malarial anaemia: mechanisms and implications of insufficient erythropoiesis during blood-stage malaria. Int. J. Parasitol. 34:1501–1516. - PubMed

Publication types

MeSH terms