Comparative Study
. 2006 May 15;203(5):1249-58.
doi: 10.1084/jem.20052433. Epub 2006 Apr 24.

Toll-like receptor agonists influence the magnitude and quality of memory T cell responses after prime-boost immunization in nonhuman primates

Affiliations
Comparative Study

Toll-like receptor agonists influence the magnitude and quality of memory T cell responses after prime-boost immunization in nonhuman primates

Ulrike Wille-Reece et al. J Exp Med. .

Abstract

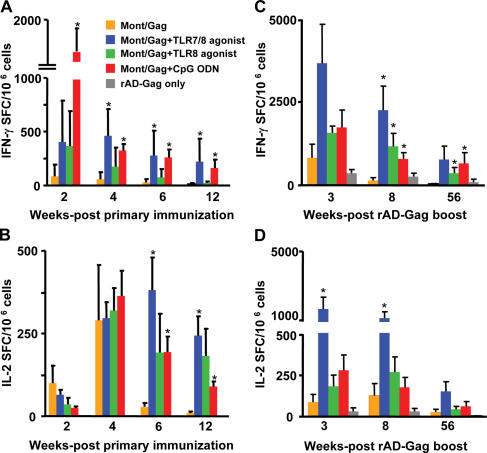
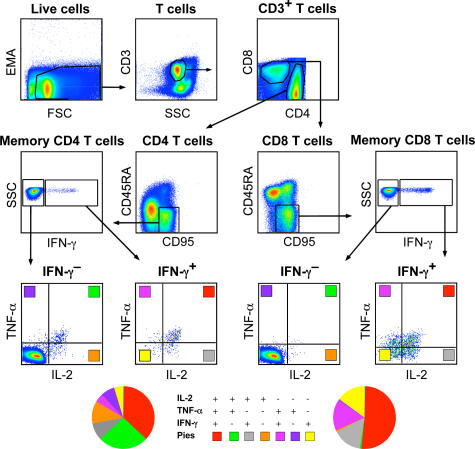
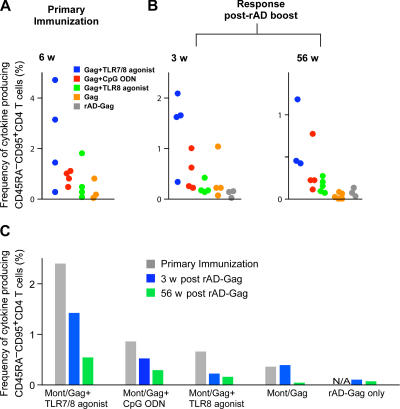
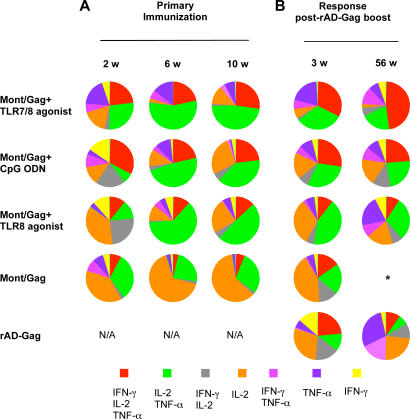
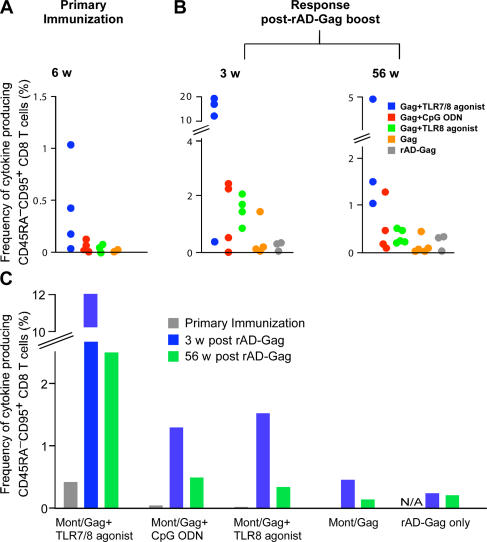
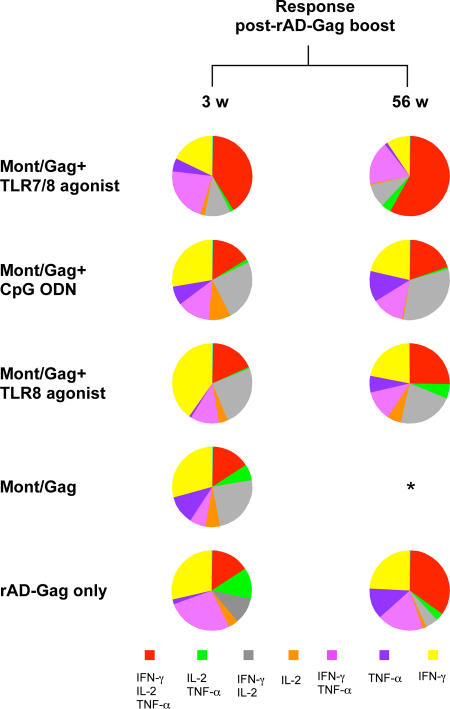
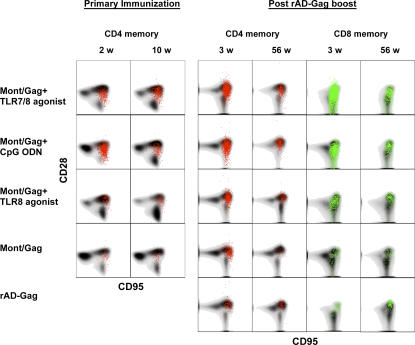
There is a remarkable heterogeneity in the functional profile (quality) of T cell responses. Importantly, the magnitude and/or quality of a response required for protection may be different depending on the infection. Here, we assessed the capacity of different Toll like receptor (TLR)-binding compounds to influence T helper cell (Th)1 and CD8+ T cell responses when used as adjuvants in nonhuman primates (NHP) with HIV Gag as a model antigen. NHP were immunized with HIV Gag protein emulsified in Montanide ISA 51, an oil-based adjuvant, with or without a TLR7/8 agonist, a TLR8 agonist, or the TLR9 ligand cytosine phosphate guanosine oligodeoxynucleotides (CpG ODN), and boosted 12 wk later with a replication-defective adenovirus-expressing HIV-Gag (rAD-Gag). Animals vaccinated with HIV Gag protein/Montanide and CpG ODN or the TLR7/8 agonist had higher frequencies of Th1 responses after primary immunization compared to all other vaccine groups. Although the rAD-Gag boost did not elevate the frequency of Th1 memory cytokine responses, there was a striking increase in HIV Gag-specific CD8+ T cell responses after the boost in all animals that had received a primary immunization with any of the TLR adjuvants. Importantly, the presence and type of TLR adjuvant used during primary immunization conferred stability and dramatically influenced the magnitude and quality of the Th1 and CD8+ T cell responses after the rAD-Gag boost. These data provide insights for designing prime-boost immunization regimens to optimize Th1 and CD8+ T cell responses.


Figures

Figure 1.
Figure 1.
The frequency of IFN-γ and IL-2–producing cells after immunization with HIV Gag protein and TLR agonists/ligands administered in Montanide. NHP were immunized once with HIV Gag protein with or without CpG ODN, a TLR7/8 or TLR8 agonist emulsified in Montanide, and boosted with rAD-Gag at 12 wk after primary immunization. PBMCs were analyzed for production of IFN-γ and IL-2 by ELISPOT assay at various times after primary immunization (A and B), or 3, 8, and 56 wk after rAD Gag boost (C and D). As controls, animals immunized with PBS, the TLR8 agonist, or CpG ODN without HIV Gag protein were boosted with rAD-Gag. Shown are the means ± SD of five monkeys (A and B), four to five monkeys (C and D), or three monkeys (rAD-Gag only) per group. *, P < 0.05 compared with Montanide/Gag group. After primary immunization, background responses for IFN-γ and IL-2 in animals that received Montanide/PBS, or a TLR agonist alone without HIV Gag protein were <10 SFC/106 cells (not depicted).
Figure 2.
Figure 2.
Phenotypic and functional characterization of memory T cells by multiparameter flow cytometry. PBMCs were analyzed after primary immunization and rAD-Gag boost by multiparameter flow cytometry. CD4+ and CD8+ T cells are first segregated into CD45RA+CD95 and CD45RACD95+ T cells. Within the CD45RACD95+ CD4+ or CD8+ T cell population, cells were separated into seven distinct populations based on production of IFN-γ, IL-2, or TNF-α in any combination, represented pictorially by the pie charts.
Figure 3.
Figure 3.
The magnitude of Gag-specific CD4+ T cell cytokine responses after prime-boost immunization. PBMCs were analyzed by multiparameter flow cytometry as described in Fig. 2. The frequency of total cytokine-producing CD45RACD95+ CD4+ T cells (IFN-γ, IL-2, or TNF-α) was analyzed at 6 wk after primary immunization (A) and 3 and 56 wk after rAD Gag boost (B). Data are shown for the individual animals in each group (A and B), or as the means of the three to five animals per group (C) shown in A and B. N/A: nonapplicable.
Figure 4.
Figure 4.
The quality of the Th1 response after prime-boost immunization. The total CD45RACD95+ CD4+ T cell cytokine response was divided into seven distinct subpopulations producing any combination of IFN-γ, IL-2, or TNF-α (Fig. 2); these data are shown as the means of their respective percentages from those animals with sufficient responses to allow for a consistent assessment of the quality (n = 4 per group, except Montanide/Gag + TLR7/8 agonist at week 56 (n = 3 animals), Montanide/Gag + TLR8 agonist at week 2 (n = 2 animals) and week 56 (n = 5 animals), rAD-Gag only group at weeks 2 and 56 (n = 2 animals), and Gag only at week 6 (n = 3 animals)). *, low number of positive events did not allow for a consistent qualitative assessment; N/A: nonapplicable. Additional analysis of the quality of the T cell responses from individual animals at 3 wk after rAD-Gag boost is shown in Fig. S3 (available at http://www.jem.org/cgi/content/full/jem.20052433/DC1).
Figure 5.
Figure 5.
The magnitude of Gag-specific CD8+ T cells after prime-boost immunization. The frequency of cytokine-producing CD45RACD95+ CD8+ T cells (IFN-γ, IL-2, or TNF-α) was analyzed at 6 wk after primary immunization (A), and 3 and 56 wk after rAD Gag boost (B) by multiparameter flow cytometry as described in Fig. 2. Data are shown for the individual animals in each group (A and B), or as the means from the three to five animals per group (C) shown in A and B. N/A: nonapplicable.
Figure 6.
Figure 6.
The quality of Gag-specific CD8+ T cells after prime-boost immunization. The total CD45RACD95+ CD8+ T cell cytokine response was divided into seven distinct subpopulations producing any combination of IFN-γ, IL-2, or TNF-α (Fig. 2); these data are shown as the means of their respective percentages from the four animals per group, except rAD-Gag only (n = 2 animals), Montanide/Gag + TLR7/8 agonist at week 56 (n = 3 animals), and Montanide/Gag + TLR8 agonist at week 56 (n = 5 animals). *, low number of positive events did not allow for a consistent qualitative assessment.
Figure 7.
Figure 7.
Characterization of central and effector memory Gag-specific T cells after prime-boost immunization. Cells were gated on CD28 and CD95, and cytokine-producing cells (IFN-γ, IL-2, or TNF-α) were overlayed as colored dots on the total CD4 or CD8 distributions shown in gray. For each vaccine group, a representative animal is shown.

Similar articles

Cited by

References

    1. Seder, R.A., and A.V. Hill. 2000. Vaccines against intracellular infections requiring cellular immunity. Nature. 406:793–798. - PubMed
    1. Baba, T.W., Y.S. Jeong, D. Pennick, R. Bronson, M.F. Greene, and R.M. Ruprecht. 1995. Pathogenicity of live, attenuated SIV after mucosal infection of neonatal macaques. Science. 267:1820–1825. - PubMed
    1. Shiver, J.W., T.M. Fu, L. Chen, D.R. Casimiro, M.E. Davies, R.K. Evans, Z.Q. Zhang, A.J. Simon, W.L. Trigona, S.A. Dubey, et al. 2002. Replication-incompetent adenoviral vaccine vector elicits effective anti-immunodeficiency-virus immunity. Nature. 415:331–335. - PubMed
    1. Seaman, M.S., L. Xu, K. Beaudry, K.L. Martin, M.H. Beddall, A. Miura, A. Sambor, B.K. Chakrabarti, Y. Huang, R. Bailer, et al. 2005. Multiclade human immunodeficiency virus type 1 envelope immunogens elicit broad cellular and humoral immunity in rhesus monkeys. J. Virol. 79:2956–2963. - PMC - PubMed
    1. Donnelly, J.J., B. Wahren, and M.A. Liu. 2005. DNA vaccines: progress and challenges. J. Immunol. 175:633–639. - PubMed

Publication types

MeSH terms