. 2006 May;127(5):577-89.
doi: 10.1085/jgp.200509473.

The light peak of the electroretinogram is dependent on voltage-gated calcium channels and antagonized by bestrophin (best-1)

Affiliations

The light peak of the electroretinogram is dependent on voltage-gated calcium channels and antagonized by bestrophin (best-1)

Lihua Y Marmorstein et al. J Gen Physiol. 2006 May.

Abstract

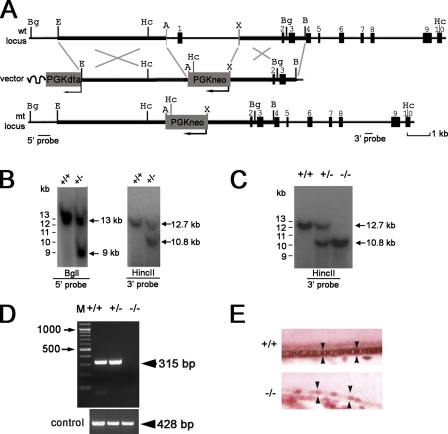
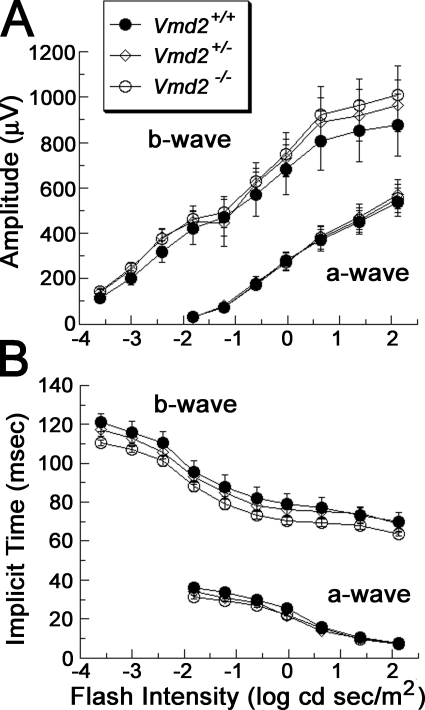
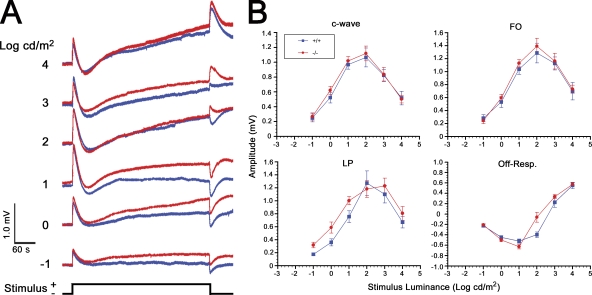
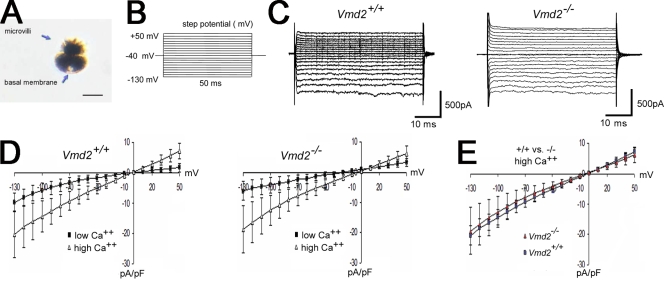
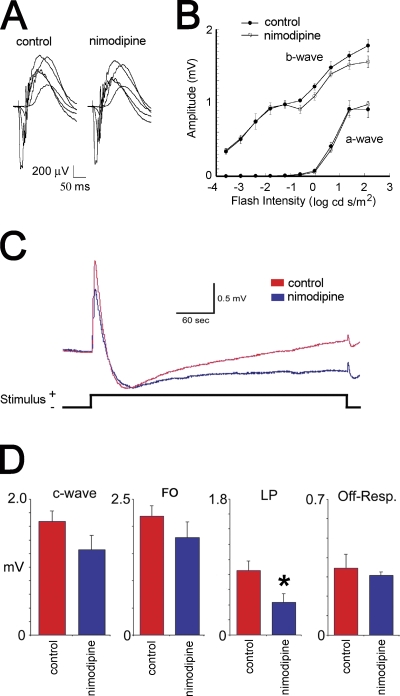
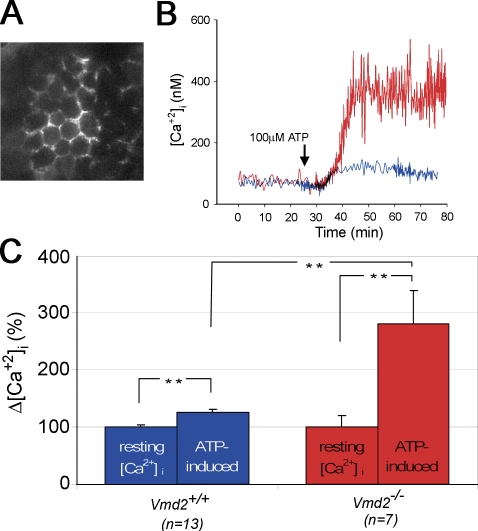
Mutations in VMD2, encoding bestrophin (best-1), cause Best vitelliform macular dystrophy (BMD), adult-onset vitelliform macular dystrophy (AVMD), and autosomal dominant vitreoretinochoroidopathy (ADVIRC). BMD is distinguished from AVMD by a diminished electrooculogram light peak (LP) in the absence of changes in the flash electroretinogram. Although the LP is thought to be generated by best-1, we find enhanced LP luminance responsiveness with normal amplitude in Vmd2-/- mice and no differences in cellular Cl- currents in comparison to Vmd2+/+ littermates. The putative Ca2+ sensitivity of best-1, and our recent observation that best-1 alters the kinetics of voltage-dependent Ca2+ channels (VDCC), led us to examine the role of VDCCs in the LP. Nimodipine diminished the LP, leading us to survey VDCC beta-subunit mutant mice. Lethargic mice, which harbor a loss of function mutation in the beta4 subunit of VDCCs, exhibited a significant shift in LP luminance response, establishing a role for Ca2+ in LP generation. When stimulated with ATP, which increases [Ca++]I, retinal pigment epithelial cells derived from Vmd2-/- mice exhibited a fivefold greater response than Vmd2+/+ littermates, indicating that best-1 can suppress the rise in [Ca2+]I associated with the LP. We conclude that VDCCs regulated by a beta4 subunit are required to generate the LP and that best-1 antagonizes the LP luminance response potentially via its ability to modulate VDCC function. Furthermore, we suggest that the loss of vision associated with BMD is not caused by the same pathologic process as the diminished LP, but rather is caused by as yet unidentified effects of best-1 on other cellular processes.


Figures

Figure 1.
Figure 1.
Targeted disruption of the Vmd2 gene. A schematic diagram of the wild-type (wt) locus, targeting vector, and mutant (mt) locus is presented in A. Thick lines represent fragments used for constructing the targeting vector 5′ and 3′ arms. Numbered solid boxes depict Vmd2 exons. The neor and DTA gene expression cassettes are indicated by the labeled gray boxes. The drawing line represents plasmid vector sequence. The external 3′ probe used in B is indicated beneath the mt locus. Restriction enzyme sites: Bg, BglI; E, EcoRI; Hc, HincII; A, AvrII; X, XbaI; B, BamHI. Southern blot analysis of wt (Vmd2 +/+), heterozygous (Vmd2 +/), and homozygous (Vmd2 /) mouse tail genomic DNA digested with HincII (B and C). The wt fragment is 12.7 kb and the mt fragment is 10.8 kb. RT-PCR analysis of total RNA was used to confirm a null phenotype (D). The 315-bp Vmd2-derived PCR product was present in Vmd2 +/+ and Vmd2 +/ mice but absent in the −/− lane. In the positive control, a 428-bp product was obtained from all mice using primers for fibulin-3. Best-1 was detected by immunohistochemistry in the RPE of Vmd2 +/+ but not Vmd2 / mice (E). Arrows in E indicate the RPE.
Figure 2.
Figure 2.
Effect of Vmd2 disruption on the flash ERG. Amplitude (A) and implicit time (B) of the a-wave and b-wave components of the dark-adapted strobe flash ERG plotted as a function of stimulus intensity. Symbols indicate the mean ± SEM result of six mice.
Figure 3.
Figure 3.
Effect of Vmd2 disruption on RPE-generated ERG components. ERGs were recorded to 7-min duration stimulus flashes from Vmd2 +/+ (blue) and Vmd2 −/− (red) mice. Grand average of responses obtained from ≥15 individual mice are shown in A for each stimulus intensity. Stimulus presentation is represented by the lower trace (black). Intensity–response functions (B) for the amplitude of the major ERG components generated by the RPE in response to light. Data points indicate the mean ± SEM of >15 responses obtained from different mice.
Figure 4.
Figure 4.
Cl conductances in RPE cells isolated from Vmd2 +/+ and Vmd2 −/− mice. RPE cells were isolated from mice as described in the Materials and Methods. As reported by Ueda and Steinberg (1994), apical microvilli could be distinguished from the basal surface of the cells as shown in A. Cl currents in response to a series of step potentials (B) were analyzed by whole cell patch-clamp in low (10 nM) or high (400 nM) Ca2+. Examples of recordings obtained from individual cells in high Ca2+ are shown in C for both Vmd2 +/+ and Vmd2 −/− mice. I/V plots for low and high Ca2+ conditions are shown in D for both Vmd2 +/+ and Vmd2 −/− mice (mean ± SD, 6 ≤ n ≤ 22 cells). Note that larger currents were obtained in high Ca2+ conditions. A comparison of currents obtained in high Ca2+ conditions (E) indicates no differences between Vmd2 +/+ and Vmd2 −/− mice.
Figure 5.
Figure 5.
Effect of Ca2+ channel blocker nimodipine on RPE-generated ERG components. The effect of nimodipine on the DC-ERG of Vmd2 +/+mice was determined 30 min after intraperitoneal injection of a 1 mg/kg dose of nimodipine using a 2 log cd/m2 stimulus. Representative ERGs (A) obtained after injection of vehicle alone (control) or 1 mg/kg nimodipine. Intensity–response functions for major ERG components are shown in B. Each data point indicates the average (±SD) for three mice. The amplitude of the a-wave was measured 8 ms after stimulus presentation. The amplitude of the b-wave was measured to the peak of the b-wave from the a-wave trough or, if no a-wave was present, from the baseline. C shows grand average dc-ERG waveforms generated from animals receiving nimodipine or vehicle alone (n = 8 both groups). Note the obvious reduction in amplitude of the LP in nimodipine-treated mice. C-wave, FO, LP, and off-response amplitudes are shown in D. Bars represent mean ± SEM.
Figure 6.
Figure 6.
Effect of nimodipine on RPE-generated ERG components of Vmd2 −/− mice. The effect of nimodipine on the DC-ERG of Vmd2 −/−mice was determined as indicated for Vmd2 +/+ mice in Fig. 5 using stimuli of 2 log cd/m2 (A and B, n = 8) or −2 log cd/m2 (C and D, n = 5). Examination of grand average waveforms (A and C) indicates that the most obvious effects are on the amplitude of the LP. Examination of maximum response amplitudes (B and D) confirms that there is minimum effect of nimodipine on the c-wave, FO, or off-response. However, the LP was significantly (*, P < 0.05) diminished at 2 log cd/m2 (B). Although the LP was reduced at −2 log cd/m2 (D), the effect was of borderline significance (P = 0.09). Data in C and D are mean ± SEM.
Figure 7.
Figure 7.
RPE-generated ERG components in the lethargic mouse. ERGs were recorded to 7-min duration stimulus flashes from control (blue) or lethargic (red) mice. Grand average of responses are shown in A for each stimulus intensity. Stimulus presentation is represented by the lower trace (black). Intensity–response functions (B) for the amplitude of the major ERG components generated by the RPE in response to light. Data points indicate the mean ± SEM. For luminance levels of 0 and 4 log cd/m2, n ≥ 5. For responses obtained at luminance levels of 1, 2, and 3 log cd/m2, n ≥ 8.
Figure 8.
Figure 8.
Effect of best-1 on changes in [Ca2+]I in response to ATP stimulation. RPE sheets were isolated from the eyes of Vmd2 +/+ or Vmd2 −/− mice (A) and loaded with fura-2. Changes in [Ca2+]I were followed in response to stimulation with 100 μM ATP. Examples of data from individual cells are shown in B, where the red tracing is from cells isolated from Vmd2 −/− mice and the blue tracing is from cells isolated from Vmd2 +/+ littermates. C indicates the maximum average percent change in [Ca2+]I (average ± SD, n = 13 for Vmd2 +/+, n = 7 for Vmd2 −/−). **, P < 0.05.

References

    1. Allikmets, R., J.M. Seddon, P.S. Bernstein, A. Hutchinson, A. Atkinson, S. Sharma, B. Gerrard, W. Li, M.L. Metzker, C. Wadelius, et al. 1999. Evaluation of the Best disease gene in patients with age-related macular degeneration and other maculopathies. Hum. Genet. 104:449–453. - PubMed
    1. Bakall, B., L.Y. Marmorstein, G. Hoppe, N.S. Peachey, C. Wadelius, and A.D. Marmorstein. 2003. Expression and localization of bestrophin during normal mouse development. Invest. Ophthalmol. Vis. Sci. 44:3622–3628. - PubMed
    1. Ball, S.L., P.A. Powers, H.-S. Shin, C.W. Morgans, N.S. Peachey, and R.G. Gregg. 2002. Role of the β2 subunit of voltage-dependent calcium channels in the retinal outer plexiform layer. Invest. Ophthalmol. Vis. Sci. 43:1595–1603. - PubMed
    1. Blair, N.P., M.F. Goldberg, G.A. Fishman, and T. Salzano. 1984. Autosomal dominant vitreoretinochoroidopathy (ADVIRC). Br. J. Ophthalmol. 68:2–9. - PMC - PubMed
    1. Bösl, M.R., V. Stein, C. Hubner, A.A. Zdebik, S.E. Jordt, A.K. Mukhopadhyay, M.S. Davidoff, A.F. Holstein, and T.J. Jentsch. 2001. Male germ cells and photoreceptors, both dependent on close cell-cell interactions, degenerate upon ClC-2 Cl channel disruption. EMBO J. 20:1289–1299. - PMC - PubMed

Publication types

MeSH terms