Comparative Study
. 2006 May;127(5):591-604.
doi: 10.1085/jgp.200509468.

Soluble mediators, not cilia, determine airway surface liquid volume in normal and cystic fibrosis superficial airway epithelia

Affiliations
Comparative Study

Soluble mediators, not cilia, determine airway surface liquid volume in normal and cystic fibrosis superficial airway epithelia

Robert Tarran et al. J Gen Physiol. 2006 May.

Abstract

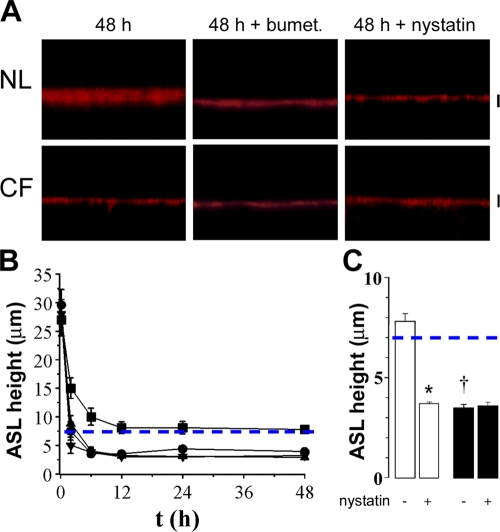
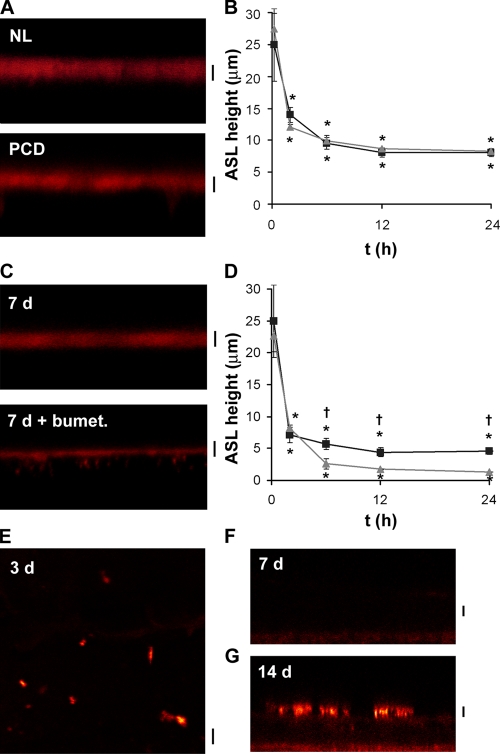
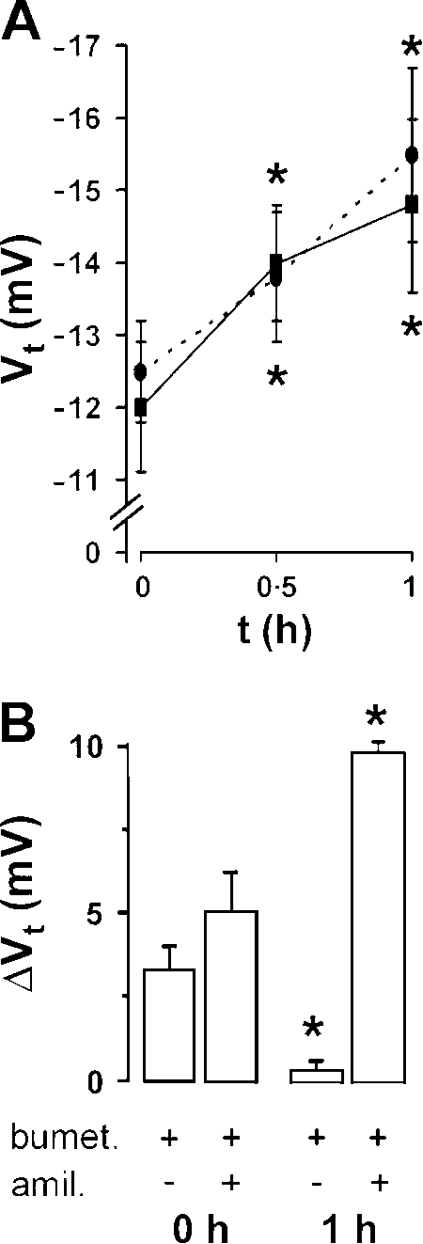
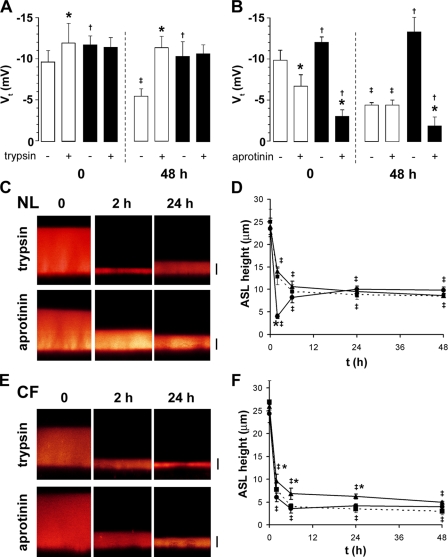
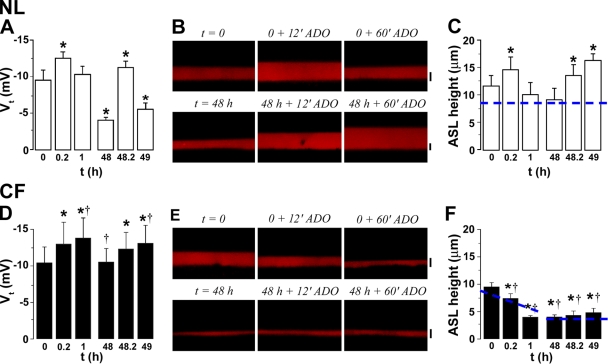
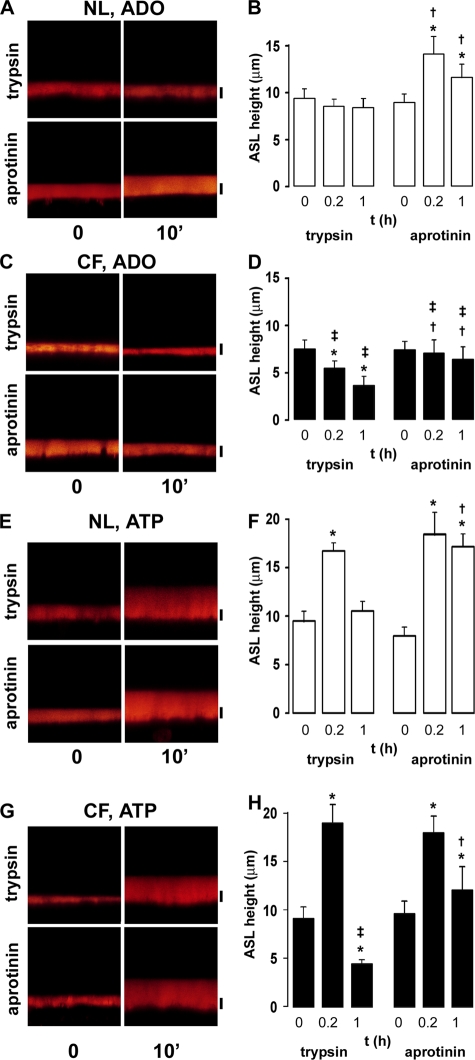
A key aspect of the lung's innate defense system is the ability of the superficial epithelium to regulate airway surface liquid (ASL) volume to maintain a 7-mum periciliary liquid layer (PCL), which is required for cilia to beat and produce mucus flow. The mechanisms whereby airway epithelia regulate ASL height to >or=7 microm are poorly understood. Using bumetanide as an inhibitor of Cl- secretion, and nystatin as an activator of Na+ absorption, we found that a coordinated "blending" of both Cl- secretion and Na+ absorption must occur to effect ASL volume homeostasis. We then investigated how ASL volume status is regulated by the underlying epithelia. Cilia were not critical to this process as (a) ASL volume was normal in cultures from patients with primary ciliary dyskinesia with immotile cilia, and (b) in normal cultures that had not yet undergone ciliogenesis. However, we found that maneuvers that mimic deposition of excess ASL onto the proximal airways, which occurs during mucociliary clearance and after glandular secretion, acutely stimulated Na+ absorption, suggesting that volume regulation was sensitive to changes in concentrations of soluble mediators in the ASL rather than alterations in ciliary beating. To investigate this hypothesis further, we added potential "soluble mediators" to the ASL. ASL volume regulation was sensitive to a channel-activating protein (CAP; trypsin) and a CAP inhibitor (aprotinin), which regulated Na+ absorption via changes in epithelial Na+ channel (ENaC) activity in both normal and cystic fibrosis cultures. ATP was also found to acutely regulate ASL volume by inducing secretion in normal and cystic fibrosis (CF) cultures, while its metabolite adenosine (ADO) evoked secretion in normal cultures but stimulated absorption in CF cultures. Interestingly, the amount of ASL/Cl- secretion elicited by ATP/ADO was influenced by the level of CAP-induced Na+ absorption, suggesting that there are important interactions between the soluble regulators which finely tune ASL volume.


Figures

Figure 1.
Figure 1.
Coordinated regulation of both Na+ and Cl transport is required for NL ASL volume homeostasis. (A) XZ confocal images of ASL (red) 48 h after 20 μl PBS addition to NL and CF cultures, 48 h after bumetanide addition (100 μM, serosal) or 30 min after nystatin addition (10 μM, mucosal). (B) Mean data for NLs (squares; n = 6), NLs with bumetanide for 48 h (circles; n = 6), CF (upward triangles; n = 6), and CF with bumetanide cultures exposed to bumetanide for 48 h (downward triangles; n = 6). Note that NL ASL height was significantly higher (P < 0.05) than in the other three groups for all time points except t = 0; statistical symbols are not shown for clarity. (C) Mean data for NL (open bars; n = 7) and CF (closed bars; n = 8) cultures exposed to nystatin for 30 min 48 h after PBS addition. Dashed blue lines depict normal ASL height (i.e., 7 μm). Bars, 7 μm. Data shown as mean ± SEM. *, different (P < 0.05) from prenystatin values. †, CF different from NL (P < 0.05).
Figure 2.
Figure 2.
Cilia are not required for ASL autoregulation. (A) XZ confocal images of ASL (red) 48 h after the addition of 20 μl PBS containing Texas red–dextran to ciliated NL and PCD cultures. (B) Mean ASL height with time after 20 μl PBS addition to NL (squares; n = 9) or PCD (circles; n = 7) cultures. (C) XZ confocal images of ASL 48 h after 20 μl PBS addition to preciliated (7 d old) NL cultures in the absence and presence of 10−4 M serosal bumetanide. (D) Mean ASL height with time after PBS addition. Preciliated cultures (upward triangles, n = 5) bumetanide-exposed cultures (downward triangles, n = 5). (E–G) Confocal micrographs showing anti-acetylated tubulin followed by Texas red secondary antibody staining in paraformaldehyde-fixed and Triton-X–permeabilized cultures. (E) XY image of 3-d-old NL airway culture. (F and G) XZ images of 7 and 14 d old cultures respectively. Note that tubulin could not be detected by either XZ or XY scans of 7-d-old NL bronchial cultures. Bars, 7 μm. *, different (P < 0.05) from t = 0. †, bumetanide-treated cultures different (P < 0.05) from control cultures.
Figure 3.
Figure 3.
ASL dilution stimulates Na+ absorption. (A) Transepithelial electric potential difference (Vt) across NL cultures with time. Solid line, before, and 1 h after apical addition of 20 μl PBS (n = 5). Broken line, before, and 1 h after apical addition of 20 μl PBS containing 15% T500 dextran (n = 6). (B) Changes in Vt in response to bumetanide (100 μM, serosal) and amiloride (300 μM, mucosal) in NL cultures (open bars, n = 8) before (0 h) and 1 h after PBS addition. *, different (P < 0.05) from t = 0.
Figure 4.
Figure 4.
Regulation of Na+ and ASL absorption by protease regulation. (A) Transepithelial electric potential difference (Vt) across NL (open bars) and CF cultures (closed bars) before and 30 min after apical trypsin (1.5 U/ml) addition at 0 or 48 h after PBS (20 μl) addition (n = 10 and 6 for NL, respectively; and 11 and 8 for CF, respectively). (B) Vt before and 30 min after apical aprotinin (2 U/ml) addition to NL (open bars) or CF (closed bars) cultures at t = 0 or 48 h after PBS addition (n = 5 and 5 for NLs; 4 and 4 for CFs, respectively). Note that all significant changes in Vt were abolished by amiloride pretreatment (3 × 10⁻⁴ M; all n = 4). (C) XZ confocal images of NL ASL (red) 0, 2, and 24 h after addition of 20 μl PBS containing Texas red–dextran with either 1.5 U/ml trypsin or 2 U/ml aprotinin. (D) Mean data taken from C. Untreated cultures (broken lines/squares, n = 7), trypsin (circles, n = 5), aprotinin (triangles, n = 5). (E) XZ confocal images of CF ASL 0, 2, and 24 h after addition of 20 μl PBS with either 1.5 U/ml trypsin or 2 U/ml aprotinin. (F) Mean data taken from E1. Untreated cultures (broken lines/squares, n = 6), trypsin (circles, n = 6), aprotinin (triangles, n = 6). *, different (P < 0.05) from pretryspsin or preaprotinin value. †, different (P < 0.05) between NL and CF cultures. ‡, different from t = 0 (P < 0.05). Bars, 7 μm.
Figure 5.
Figure 5.
Contrasting effects of adenosine on ion transport and ASL volume in NL and CF cultures. (A and D) Transepithelial PD (Vt) in NL (open bars, n = 6) and CF (closed bars, n = 5) cultures, respectively, after exposure to 300 μM mucosal adenosine (ADO) added at t = 0 and 48 h after mucosal PBS addition. Note that changes in NL but not CF Vt were inhibited by 10−4 M serosal bumetanide addition (all n = 3). (B and E) XZ confocal images of ASL before (0), 12 min, and 60 min after mucosal ADO addition (300 μM) to NL and CF cultures, respectively, at t = 0 or 48 h after 20 μl PBS addition. (C and F) Mean ASL height in NL (open bars, n = 7) and CF (closed bars, n = 8) cultures. The change in ASL height over 1 h of imaging in nontreated cultures is shown as a dashed line. 1 h untreated values for NL cultures were 9.0 ± 2.5 μm and 8.4 ± 1.2 μm (P < 0.05) at t = 1 h and t = 49 h, respectively (both n = 5). 1 h untreated values for CF cultures were 5.3 ± 0.4 μm (P < 0.05) and 4.0 ± 0.3 μm at t = 1 h and t = 49 h, respectively (both n = 7). *, significantly different from preADO (0, 48 h) value. †, data significantly different between NL and CF cultures. Bars, 7 μm.
Figure 6.
Figure 6.
Interaction between CAP and ADO/ATP signaling systems. (A) XZ confocal images of NL cultures acutely prewashed with PBS containing Texas red–dextran and either trypsin (1.5 U/ml) or aprotinin (2 U/ml) 0, 10, and 60 min post-ADO addition (300 μM). (B) Mean data taken from A. (C) XZ confocal images of CF cultures acutely prewashed with PBS/Texas red–dextran and either trypsin or aprotinin 0, 10, and 60 min after ADO addition. (D) Mean data taken from C. (E) XZ images of NL cultures prewashed with PBS/Texas red–dextran with either trypsin or aprotinin 0, 10, and 60 min after ATP addition (300 μM). (F) Mean data taken from E. (G) XZ confocal images of CF cultures prewashed with PBS/Texas red–dextran with either trypsin or aprotinin 0, 10, and 60 min after ATP addition. (H) Mean data taken from G. All data points are n = 6. *, different (P < 0.05) from t = 0. †, different (P < 0.05) from equivalent time point in the presence of tryspsin. ‡, different (P < 0.05) between NL and CF cultures. Bars, 7 μm.

Similar articles

Cited by

References

    1. Alton, E.W., A. Khagani, M.H. Yacoub, and D.M. Geddes. 1989. Lack of effect of lung denervation on the measurement of potential difference after single-lung transplantation. N. Engl. J. Med. 320:1755 (letter). - PubMed
    1. Andrade, Y.N., J. Fernandes, E. Vazquez, J.M. Fernandez-Fernandez, M. Arniges, T.M. Sanchez, M. Villalon, and M.A. Valverde. 2005. TRPV4 channel is involved in the coupling of fluid viscosity changes to epithelial ciliary activity. J. Cell Biol. 168:869–874. - PMC - PubMed
    1. Boucher, R.C. 1994. Human airway ion transport (Part 1). Am. J. Respir. Crit. Care Med. 150:271–281. - PubMed
    1. Boucher, R.C., M.J. Stutts, M.R. Knowles, L. Cantley, and J.T. Gatzy. 1986. Na+ transport in cystic fibrosis respiratory epithelia. Abnormal basal rate and response to adenylate cyclase activation. J. Clin. Invest. 78:1245–1252. - PMC - PubMed
    1. Bridges, R.J., B.B. Newton, J.M. Pilewski, D.C. Devor, C.T. Poll, and R.L. Hall. 2001. Na+ transport in normal and CF human bronchial epithelial cells is inhibited by BAY 39-9437. Am. J. Physiol. 281:L16–L23. - PubMed

Publication types

MeSH terms