. 2006 May 2;103(18):7118-23.
doi: 10.1073/pnas.0602006103. Epub 2006 Apr 24.

NPAS2 as a transcriptional regulator of non-rapid eye movement sleep: genotype and sex interactions

Affiliations

NPAS2 as a transcriptional regulator of non-rapid eye movement sleep: genotype and sex interactions

Paul Franken et al. Proc Natl Acad Sci U S A. .

Abstract

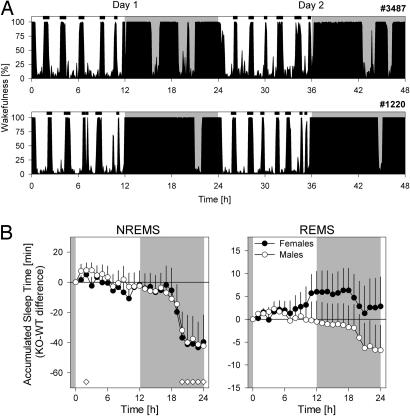
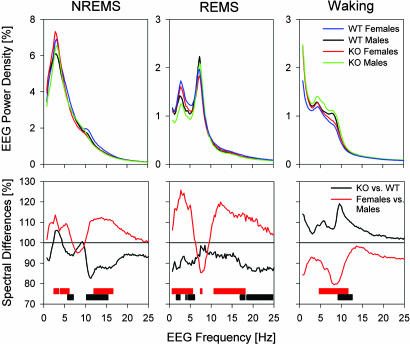
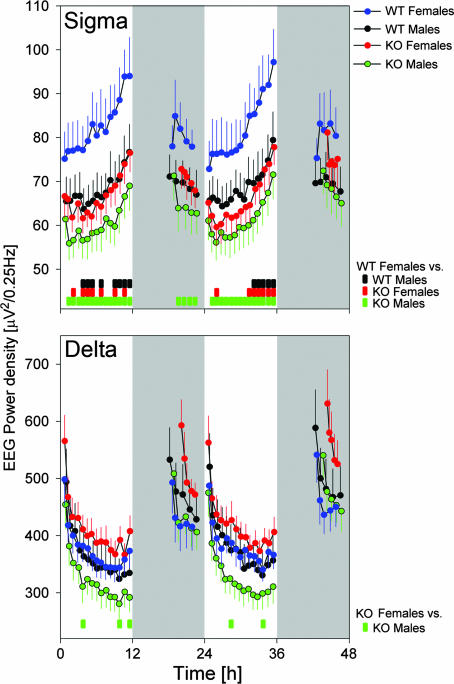
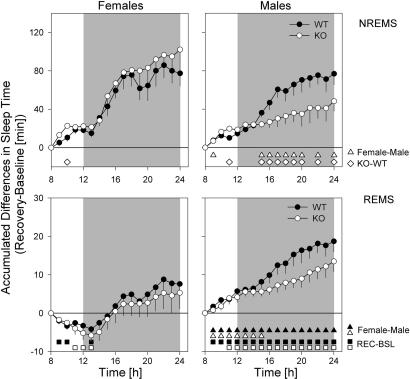
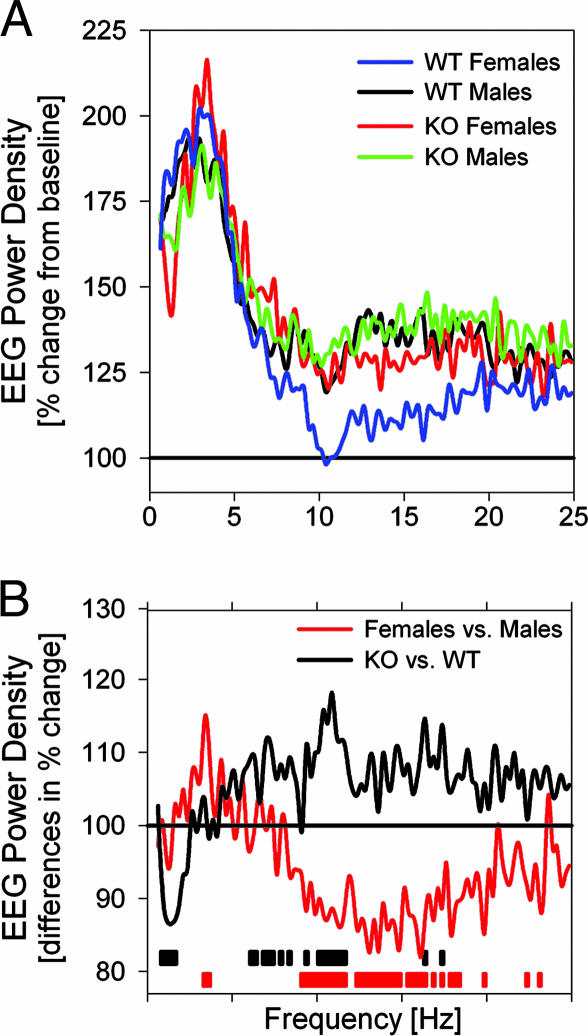
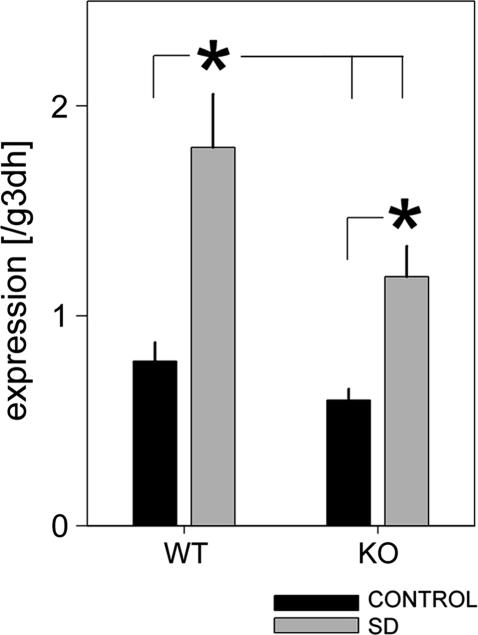
Because the transcription factor neuronal Per-Arnt-Sim-type signal-sensor protein-domain protein 2 (NPAS2) acts both as a sensor and an effector of intracellular energy balance, and because sleep is thought to correct an energy imbalance incurred during waking, we examined NPAS2's role in sleep homeostasis using npas2 knockout (npas2-/-) mice. We found that, under conditions of increased sleep need, i.e., at the end of the active period or after sleep deprivation (SD), NPAS2 allows for sleep to occur at times when mice are normally awake. Lack of npas2 affected electroencephalogram activity of thalamocortical origin; during non-rapid eye movement sleep (NREMS), activity in the spindle range (10-15 Hz) was reduced, and within the delta range (1-4 Hz), activity shifted toward faster frequencies. In addition, the increase in the cortical expression of the NPAS2 target gene period2 (per2) after SD was attenuated in npas2-/- mice. This implies that NPAS2 importantly contributes to the previously documented wake-dependent increase in cortical per2 expression. The data also revealed numerous sex differences in sleep; in females, sleep need accumulated at a slower rate, and REMS loss was not recovered after SD. In contrast, the rebound in NREMS time after SD was compromised only in npas2-/- males. We conclude that NPAS2 plays a role in sleep homeostasis, most likely at the level of the thalamus and cortex, where NPAS2 is abundantly expressed.


Conflict of interest statement

Conflict of interest statement: No conflicts declared.

Figures

Fig. 1.
Fig. 1.
Sleep–wake distribution during baseline. (A) Examples of wake distribution in baseline for two mice (no. 3487, WT female; no. 1220, KO male). Black area depicts percent wakefulness in 5-min intervals. Note the highly regular occurrence of sustained waking bouts during the rest period. Periodogram analysis revealed a significant 128-min periodicity in all individuals. Ultradian sleep–wake patterns of such periodicity have not been described previously. (B) Genotype comparison of the accumulation of sleep time in baseline. NREMS (Left) and REMS (Right) values in KO mice were expressed relative to WT. Indicated are hourly increments averaged over 2 baseline days (±1 SE of the difference) for females (filled symbols) and males (open symbols). Diamonds indicate significant genotype differences (P < 0.05, t tests). Gray areas denote dark periods.
Fig. 2.
Fig. 2.
EEG spectral profiles under baseline conditions averaged for all 4-s epochs scored as NREMS (Left), REMS (Middle), or waking (Right). (Upper) Average EEG spectra normalized to total EEG power. (Lower) Spectral differences as percent change for KO (black line; n = 19) versus WT (= 100%; n = 19) mice and for females (red lines; n = 16) versus males (= 100%; n = 22). Significant genotype differences are indicated by black bars; sex differences are indicated by red bars (P < 0.05, t tests).
Fig. 3.
Fig. 3.
Baseline time course of sigma (10–15 Hz; Upper) and delta (1–4 Hz; Lower) EEG activity in NREMS. Values represent mean absolute values (±1 SEM) calculated over 15- and 5-NREMS-time percentiles in the light and dark periods, respectively. Large genotype and sex effects were present for both frequency bands [three-way ANOVA (factors genotype, sex, and time), P < 0.0001; except the genotype for delta, P = 0.51), and sex affected the genotype effect (interaction P < 0.0001). The time-dependent changes in both variables did not differ among groups. Colored bars at the bottom indicate intervals in which EEG power differed among groups (P < 0.05, t tests).
Fig. 4.
Fig. 4.
Accumulation of recovery-baseline (REC-BSL) differences in sleep time. Differences in NREMS time (Upper) and REMS (Lower) are calculated at 1-h increments for 18 h, starting from the end of the SD (ZT8). Indicated are mean differences (±1 SE of the difference) for females (Left) and males (Right). For NREMS, accumulated values were significantly above baseline from the first interval onward (P < 0.05, t tests) for all four groups (WT, filled symbols; KO, open symbols). For REMS-significant REC-BSL, differences are indicated with open (KO) and filled (WT) squares. Significant genotype differences within each sex are indicated by diamonds; significant sex differences are indicated by open (KO) and filled (WT) triangles (P < 0.05, t tests).
Fig. 5.
Fig. 5.
Spectral changes in the NREMS EEG immediately after SD. (A) In the first 30 min of recovery, prominent increases in EEG power were observed in all groups except in the 9.5- to 17.75-Hz range for WT females (statistics not indicated). Values are expressed as a percentage of corresponding baseline values. (B) Group comparisons revealed different responses to SD: percent change in KO vs. WT (black line) and females vs. males (red line). Frequency bins with significant genotype and sex differences are indicated by black and red bars, respectively (P < 0.05, t tests).
Fig. 6.
Fig. 6.
Mean (±1 SEM) forebrain per2 mRNA levels during baseline and after 6 h of SD determined by real-time RT-PCR. SD increased per2 expression, but lower values were reached in npas2−/− (KO) compared with WT mice (∗, P < 0.05, post hoc Tukey's test, n = 8 per experimental group; two-way ANOVA, factor SD, P < 0.0001; genotype, P = 0.011; interaction, P = 0.15).

Similar articles

Cited by

References

    1. Zhou Y. D., Barnard M., Tian H., Li X., Ring H. Z., Francke U., Shelton J., Richardson J., Russell D. W., McKnight S. L. Proc. Natl. Acad. Sci. USA. 1997;94:713–718. - PMC - PubMed
    1. Gu Y. Z., Hogenesch J. B., Bradfield C. A. Annu. Rev. Pharmacol. Toxicol. 2000;40:519–561. - PubMed
    1. Rutter J., Reick M., Wu L. C., McKnight S. L. Science. 2001;293:510–514. - PubMed
    1. Borbely A. A. Hum. Neurobiol. 1982;1:195–204. - PubMed
    1. Benington J. H., Heller H. C. Prog. Neurobiol. 1995;45:347–360. - PubMed

Publication types

MeSH terms