Review
. 2006 Apr;208(4):491-512.
doi: 10.1111/j.1469-7580.2006.00546.x.

The effects of exercise on human articular cartilage

Affiliations
Review

The effects of exercise on human articular cartilage

F Eckstein et al. J Anat. 2006 Apr.

Abstract

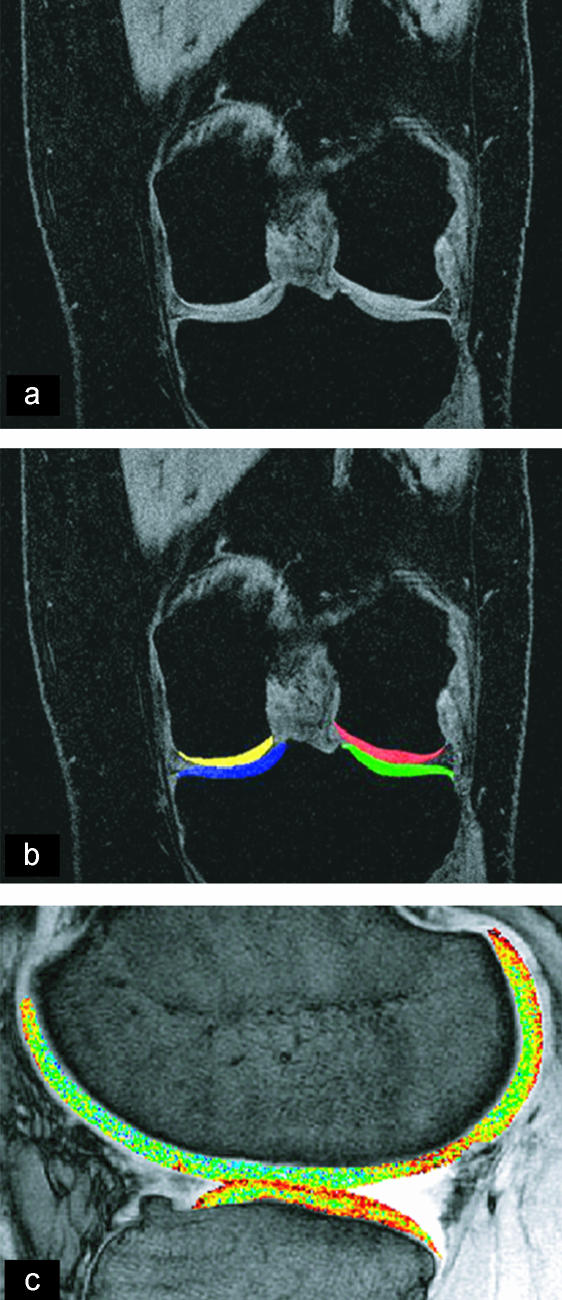
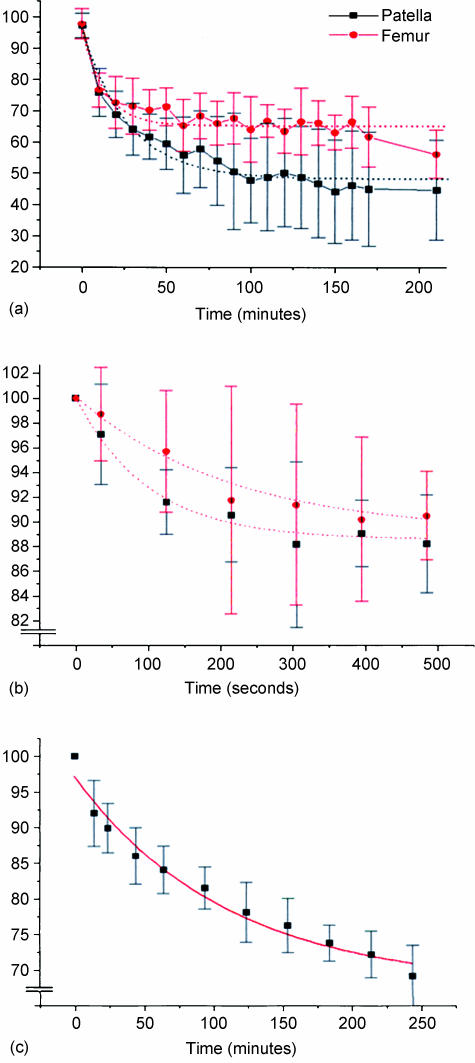
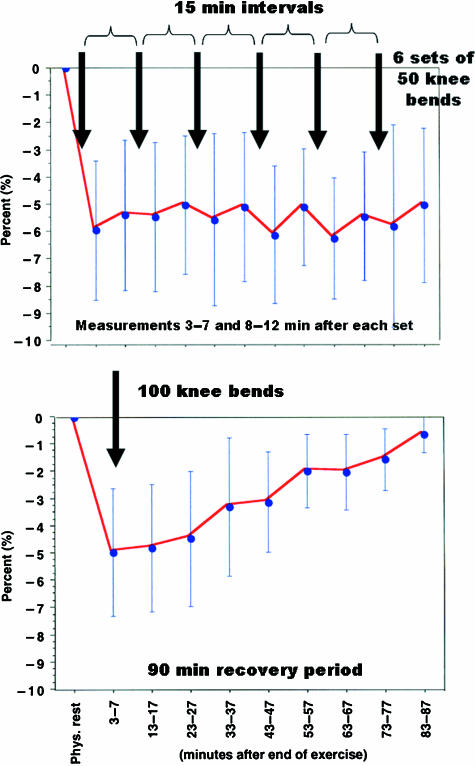
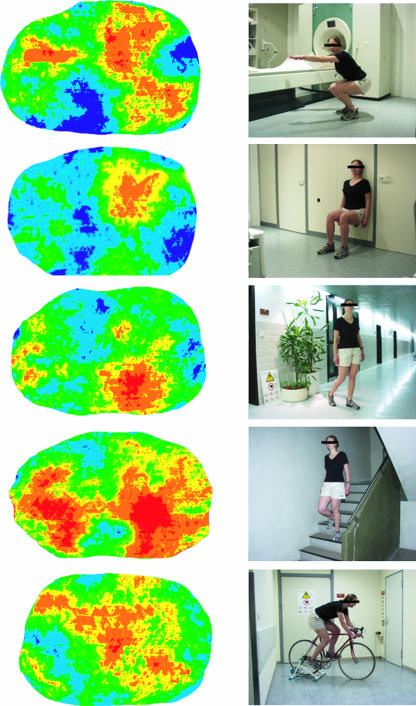
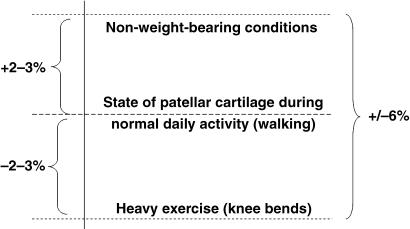
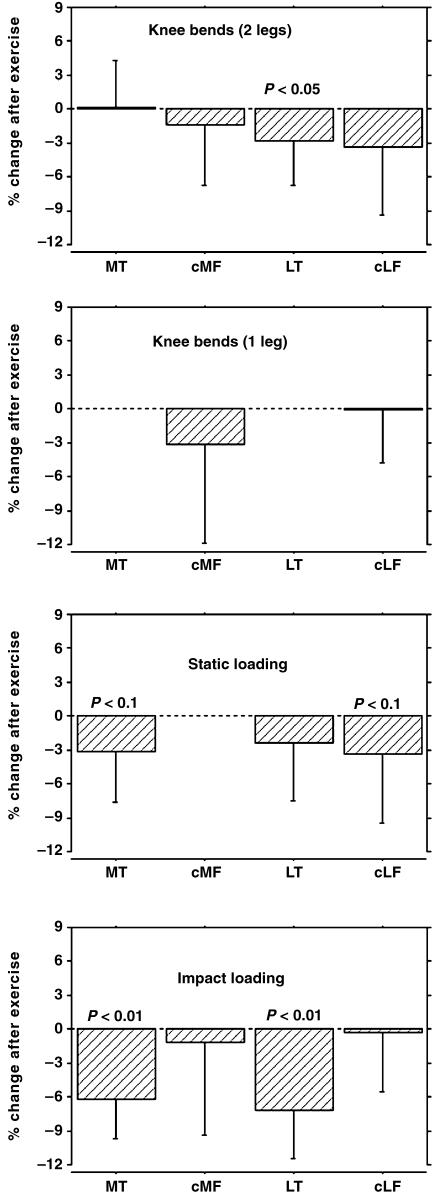
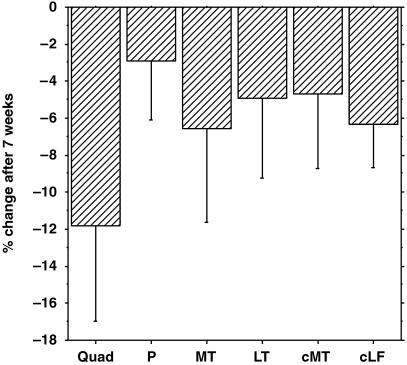
The effects of exercise on articular hyaline articular cartilage have traditionally been examined in animal models, but until recently little information has been available on human cartilage. Magnetic resonance imaging now permits cartilage morphology and composition to be analysed quantitatively in vivo. This review briefly describes the methodological background of quantitative cartilage imaging and summarizes work on short-term (deformational behaviour) and long-term (functional adaptation) effects of exercise on human articular cartilage. Current findings suggest that human cartilage deforms very little in vivo during physiological activities and recovers from deformation within 90 min after loading. Whereas cartilage deformation appears to become less with increasing age, sex and physical training status do not seem to affect in vivo deformational behaviour. There is now good evidence that cartilage undergoes some type of atrophy (thinning) under reduced loading conditions, such as with postoperative immobilization and paraplegia. However, increased loading (as encountered by elite athletes) does not appear to be associated with increased average cartilage thickness. Findings in twins, however, suggest a strong genetic contribution to cartilage morphology. Potential reasons for the inability of cartilage to adapt to mechanical stimuli include a lack of evolutionary pressure and a decoupling of mechanical competence and tissue mass.


Figures

Fig. 1
Fig. 1
(a) Coronal MR imaging (slice thickness 1.5 mm, in-plane resolution 0.31 mm × 0.31 mm) acquired with a T1-weighted spoiled gradient echo sequence (FLASH = fast low angle shot; or SPGR = spoiled gradient recalled acquisition at steady state) with frequency-selective water excitation. (b) Segmentation showing the medial tibial cartilage in blue, the medial femoral condyle in yellow, the lateral tibia cartilage in green, and the lateral femoral cartilage in red. (c) Sagittal dGEMRIC image kindly provided by Dr Deborah Burstein, Beth Israel Deaconess Medical Center, Harvard Medical School, Boston, MA, USA.
Fig. 2
Fig. 2
(a) Three-dimensional reconstruction of femoral and tibial cartilage from segmentations of contiguous MR images; (b) distribution pattern of cartilage thickness in the femur, determined independent of the original section orientation. The blue colour shows areas of thick cartilage, orange and red show areas of thin cartilage.
Fig. 3
Fig. 3
The non-metallic compression apparatus that fits into the extremity coil of a clinical MRI scanner is capable of generating loads of up to 1500 N using a pneumatic pressure piston, and can accommodate a human patellofemoral joint at a 60° flexion angle. The patella and pressure piston are guided between Delrin trays, so that the cartilage deformation could be monitored using a fast two-dimensional MR imaging sequence with an acquisition time of < 1 min. Images on the right show the status of the femoropatellar cartilage before compression (t = 0 min) and after 120 min and 240 min of compression, respectively.
Fig. 4
Fig. 4
In situ compression of patellofemoral cartilage using the compression device shown in Fig. 3. (a) Graph showing the mean reduction of thickness in a central axial 2D slice through the patellofemoral contact zone over 3.5 h of static loading with 150% body weight; (b) only a small fraction of the final thickness is reached during the first few minutes of static loading; (c) patellar cartilage volume (measured over the entire patella) was reduced by approximately 30% after 3.5 h of loading.
Fig. 5
Fig. 5
Patellar cartilage deformation after six sets of 50 knee bends at 15-min intervals (top), and during recovery after 100 knee bends (bottom).
Fig. 6
Fig. 6
In vivo deformation patterns of patellar cartilage after different physiological activities (see text). A posterior view onto the right patellar cartilage surface (proximal pole of the patella on top, medial side on the left): average of differences in cartilage thickness before and after various activities averaged over 12 volunteers. Red and orange colours show areas of high deformation, blue colour areas of little deformation.
Fig. 7
Fig. 7
Scheme showing the state of patellar cartilage deformation (cartilage thickness change) during normal daily activity and the physiological window of cartilage deformation between non-weight-bearing conditions and heavy exercise, such as deep knee bends.
Fig. 8
Fig. 8
Graphs showing the magnitude of tibiofemoral cartilage deformation (change in mean thickness) and level of significance after various types of activities: MT = medial tibia; cMF = central medial femur (condyle); LT = lateral tibia; cLF = central lateral femur (condyle).
Fig. 9
Fig. 9
Graph showing the average change in quadriceps cross-sectional area and in cartilage thickness during 7 weeks of partial weight bearing of the knee (sole contact) in a group of 20 volunteers following a fracture of the ankle joint.
Fig. 10
Fig. 10
Graph showing the side differences of quadriceps cross-sectional area (CSA) and mean patellar cartilage thickness (in percentage left vs. right) during a 24-month remobilization period in one subject, after 6 weeks of immobilization of the left limb, with no weight bearing and restriction of knee movement from 0° to 30° of flexion.

References

    1. Al Ali D, Graichen H, Faber S, et al. Quantitative cartilage imaging of the human hind foot: precision and inter-subject variability. J Orthop Res. 2002;20:249–256. - PubMed
    1. Antoniades L, Spector TD, MacGregor AJ. The genetic contribution to hip joint morphometry and relationship to hip cartilage thickness. Osteoarthritis Cartilage. 2001;9:593–595. - PubMed
    1. Ateshian GA, Soslowsky LJ, Mow VC. Quantitation of articular surface topography and cartilage thickness in knee joints using stereophotogrammetry. J Biomech. 1991;24:761–776. - PubMed
    1. Ateshian GA, Lai WM, Zhu WB, Mow VC. An asymptotic solution for the contact of two biphasic cartilage layers. J Biomech. 1994;27:1347–1360. - PubMed
    1. Ateshian G, Mow VC. Friction, lubrication, and wear of articular cartilage and diathrodial joints. In: Mow VC, Huskes R, editors. Basic Orthopaedic Biomechanics and Mechanobiology. 3. Philadelphia: Lippincott, Williams & Wilkins; 2005. pp. 447–494.

MeSH terms