Comparative Study
. 2006 Apr 25:7:13.
doi: 10.1186/1471-2091-7-13.

Characterization of hARD2, a processed hARD1 gene duplicate, encoding a human protein N-alpha-acetyltransferase

Affiliations
Comparative Study

Characterization of hARD2, a processed hARD1 gene duplicate, encoding a human protein N-alpha-acetyltransferase

Thomas Arnesen et al. BMC Biochem. .

Abstract

Background: Protein acetylation is increasingly recognized as an important mechanism regulating a variety of cellular functions. Several human protein acetyltransferases have been characterized, most of them catalyzing epsilon-acetylation of histones and transcription factors. We recently described the human protein acetyltransferase hARD1 (human Arrest Defective 1). hARD1 interacts with NATH (N-Acetyl Transferase Human) forming a complex expressing protein N-terminal alpha-acetylation activity.

Results: We here describe a human protein, hARD2, with 81 % sequence identity to hARD1. The gene encoding hARD2 most likely originates from a eutherian mammal specific retrotransposition event. hARD2 mRNA and protein are expressed in several human cell lines. Immunoprecipitation experiments show that hARD2 protein potentially interacts with NATH, suggesting that hARD2-NATH complexes may be responsible for protein N-alpha-acetylation in human cells. In NB4 cells undergoing retinoic acid mediated differentiation, the level of endogenous hARD1 and NATH protein decreases while the level of hARD2 protein is stable.

Conclusion: A human protein N-alpha-acetyltransferase is herein described. ARD2 potentially complements the functions of ARD1, adding more flexibility and complexity to protein N-alpha-acetylation in human cells as compared to lower organisms which only have one ARD.


Figures

Figure 1
Figure 1
Human ARD2 gene expression. (A) The genomic organization of the hARD2 gene on Chromosome 4 (not to scale) displaying Exon1, Exon2, Intron, the open reading frame (ORF), the nucleotides in the splice sites and the primers pr1-pr4. The registered cDNA sequences BC004552 and BC063623 are also indicated. (B) RT-PCR of the hARD2 ORF using the primers pr1 and pr3 in the cell lines Jurkat (1), HEK293 (2), NPA (3). β-Actin is used as an internal control. (C) Detection of hARD2 exon 1–2 specific PCR product (381 nts) using primers pr2 and pr4 in the cell lines Jurkat (1) and HeLa (2). The asterisk denotes an unspecific PCR product.
Figure 2
Figure 2
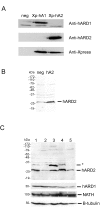
Detection of hARD2 protein. (A) HEK293 cells were transiently transfected with plasmids encoding Xpress-lacZ as a negative control (neg), Xpress hARD1 (Xp-hA1) or Xpress hARD2 (Xp-hA2) and after 48 h processed by SDS-PAGE and Western blotting. Different membranes were incubated with anti-hARD1, anti-hARD2 and anti-Xpress as indicated. (B) HEK293 cells were transiently transfected with a plasmid encoding native hARD2 (hA2) or Xpress-lacZ as a negative control (neg) and after 48 h processed by SDS-PAGE and Western blotting. The membrane was incubated with anti-hARD2. (C) Different cell lines were lysed and approximately 8 μg of total protein was analyzed as above. The membrane was incubated with anti-hARD2, anti-β-tubulin, anti-hARD1 and anti-NATH. 1: SK-MEL2; 2: HEK293; 3: HeLa; 4: MCF-7; 5: NB4. The asterisk denotes an unspecific band or a slower migrating hARD2 variant.
Figure 3
Figure 3
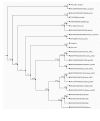
Phylogenetic tree of ARD genes. Phylogenetic tree showing that the speciation resulting in the marsupials, probably precedes the gene duplication that resulted in ARDs. All identifiers are from Ensembl, except for 061219 (UniProt), 12718517 and 28422364 (GenBank GI numbers), Opossum (Ensembl prediction 'Built_from_P41227_and_others_1') and Kangaroo (which is a consensus sequence of all the Kangaroo sequences described in this paper). The protein sequences were aligned using T-Coffee, a coding sequence alignment was produced from this, the best aligned section was extracted (positions 53–214 in the protein alignment, positions 157–642 in the coding sequence alignment), and from this a new tree was generated using MrBayes (3000000 generations, 250000 burn-in, different rates for transitions and transversions, gamma distributed rates across sites). This tree was then rooted by mapping it to the NCBI tree of life whilst miniming the number of gene duplication and loss events when allowing poorly supported branches to be rearranged (Berglund, Steffansson, Betts and Liberles, Manuscript submitted). The figures on the branches are posterior probabilities produced by MrBayes. The two branches marked 'X' are the result of rearrangements during the rooting of the tree.
Figure 4
Figure 4
Alignment of selected mammalian ARD proteins. The top four sequences are Human, Chimp, Mouse and Rat ARD1, respectively. The bottom five are Human, Chimp, Mouse and Rat ARD2, plus the additional Rat ARD whose expression was confirmed. ARD1 exons are shown as alternating shaded and unshaded regions and exon boundaries that split a codon are shown in darker shading. The large boxed region is for the acetyltransferase domain (identified by a match to Pfam domain PF00583). The smaller boxed region at position 117 shows the Ala-Pro substituion in human ARD2. Sequence identifiers are from Ensembl.
Figure 5
Figure 5
hARD2 interacts with NATH and HIF-1α. (A)HEK293 cells, transfected with plasmids encoding hARD2-V5 or lacZ-V5 as a negative control, were harvested and the lysates were immunoprecipitated (IP) with the anti-V5 antibody. The immunoprecipitates were analysed by SDS-PAGE and Western Blotting. The membrane was incubated with anti-NATH. The amount of lysate loaded on the gel represents approx. 10 % of the material used in the immunoprecipitation reaction. (B) MCF-7 cells were cotransfected with plasmids encoding HA-HIF-1α and X-press-hARD2 or X-press-lacZ as a negative control. After 48 hours the cells were collected and processed as (A). The membrane was incubated with anti-HA.
Figure 6
Figure 6
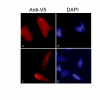
Subcellular localization of hARD2-V5 by immunofluorescence. HeLa cells were transiently transfected with plasmid expressing hARD2-V5, fixed and labelled with anti-V5 and thereafter with Alexa-568-conjugated antibody. Images display hARD2-V5 in red (A and C) and nuclear DAPI staining in blue (B and D). Untransfected cells demonstrating the background staining levels of Alexa-568 can be observed in C next to the transfected cells.
Figure 7
Figure 7
N-Acetyltransferase activity of hARD2. (A) N-terminal acetyltransferase assay using immunoprecipitated Xpress-lacZ (negative control), Xpress-hARD1 or Xpress-hARD2 complexes as the enzyme. Radioactivity [14-C] incorporated into the ACTH substrate was determined by scintillation counting. The activity data (cpm) were adjusted according to the FUJIFILM IR-LAS 1000 and Image Gauge v.3.45 relative arbitary units representing levels of Xpress-lacZ/hARD1/hARD2 proteins. The activity of Xpress-lacZ was defined as background and was subtracted from the Xpress-hARD1 and Xpress-hARD2 activity to obtain the specific activity presented.
Figure 8
Figure 8
Regulation of hARD1, hARD2 and NATH during differentiation. NB4 cells were treated with 1 μM all-trans retinoic acid for 96 hours. Untreated wells were cultured in parallel as a negative control. Cells were lysed and analyzed by SDS-PAGE and Western blotting. 10 μg total protein was loaded in each well. Membranes were incubated with the indicated antibodies, anti-hARD1, anti-hARD2, anti-NATH and anti-β-tubulin. The data presented was representative of four independent experiments. Protein levels were quantitated using FUJIFILM IR LAS 1000 and Image Gauge 3.45. Protein levels in control (-) samples were set to 1.0 and protein levels in treated cells (+) were estimated relative to this and normalized to B-tubulin levels. Pictures in the lower panel show representative cells after 96 hours of treatment (+) or control (-). Cells were stained using May-Grünwald-Giemsa.

Similar articles

Cited by

References

    1. Park EC, Szostak JW. Ard1 and Nat1 Proteins Form A Complex That Has N-Terminal Acetyltransferase Activity. EMBO J. 1992;11:2087–93. - PMC - PubMed
    1. Polevoda B, Norbeck J, Takakura H, Blomberg A, Sherman F. Identification and specificities of N-terminal acetyltransferases from Saccharomyces cerevisiae. EMBO J. 1999;18:6155–6168. doi: 10.1093/emboj/18.21.6155. - DOI - PMC - PubMed
    1. Arnold RJ, Polevoda B, Reilly JP, Sherman F. The action of N-terminal acetyltransferases on yeast ribosomal proteins. J Biol Chem. 1999;274:37035–37040. doi: 10.1074/jbc.274.52.37035. - DOI - PubMed
    1. Polevoda B, Sherman F. N-terminal acetyltransferases and sequence requirements for N-terminal acetylation of eukaryotic proteins. J Mol Biol. 2003;325:595–622. doi: 10.1016/S0022-2836(02)01269-X. - DOI - PubMed
    1. Polevoda B, Sherman F. Composition and function of the eukaryotic N-terminal acetyltransferase subunits. Biochem Biophys Res Commun. 2003;308:1–11. doi: 10.1016/S0006-291X(03)01316-0. - DOI - PubMed

Publication types

MeSH terms