. 2006 Apr 26;26(17):4602-12.
doi: 10.1523/JNEUROSCI.5204-05.2006.

Interaction of Kv3 potassium channels and resurgent sodium current influences the rate of spontaneous firing of Purkinje neurons

Affiliations

Interaction of Kv3 potassium channels and resurgent sodium current influences the rate of spontaneous firing of Purkinje neurons

Walther Akemann et al. J Neurosci. .

Abstract

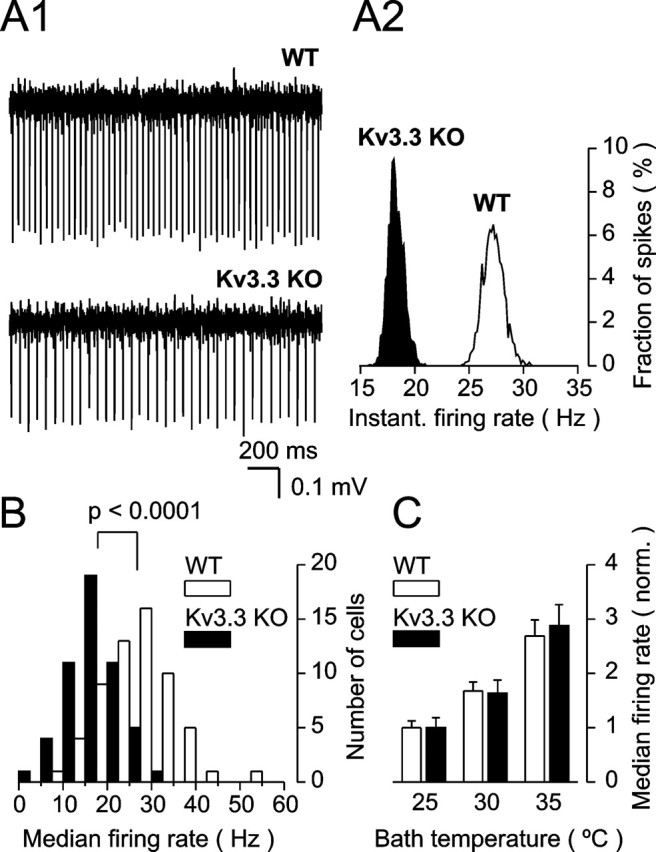
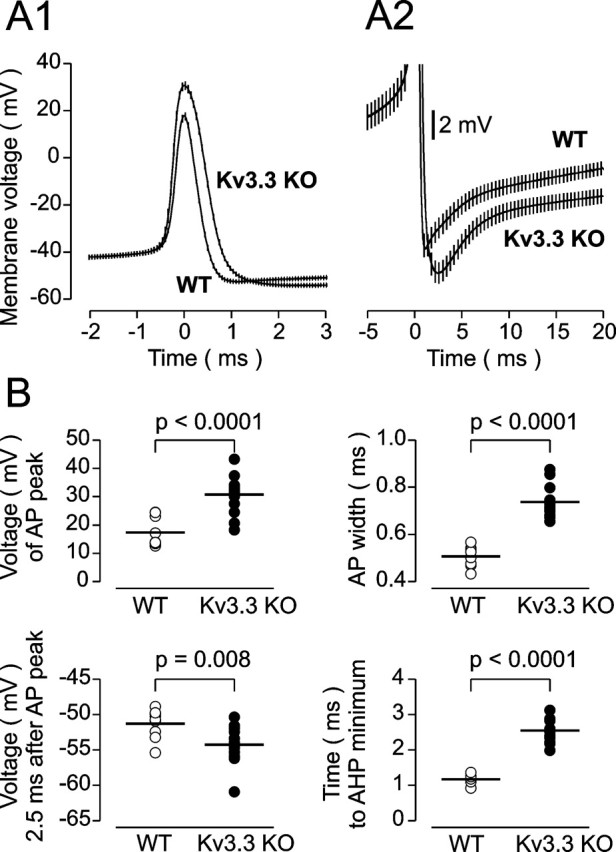
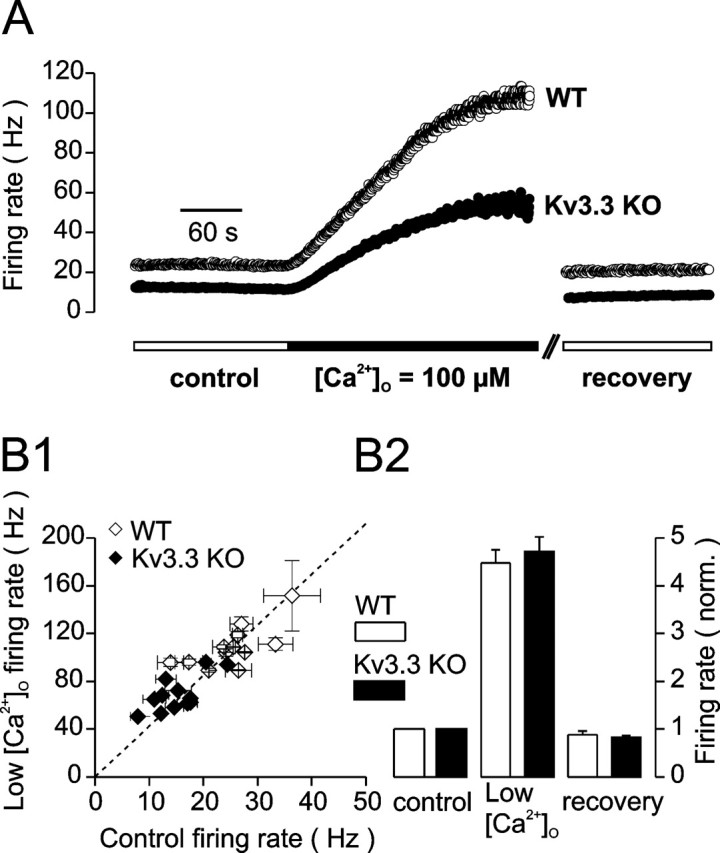
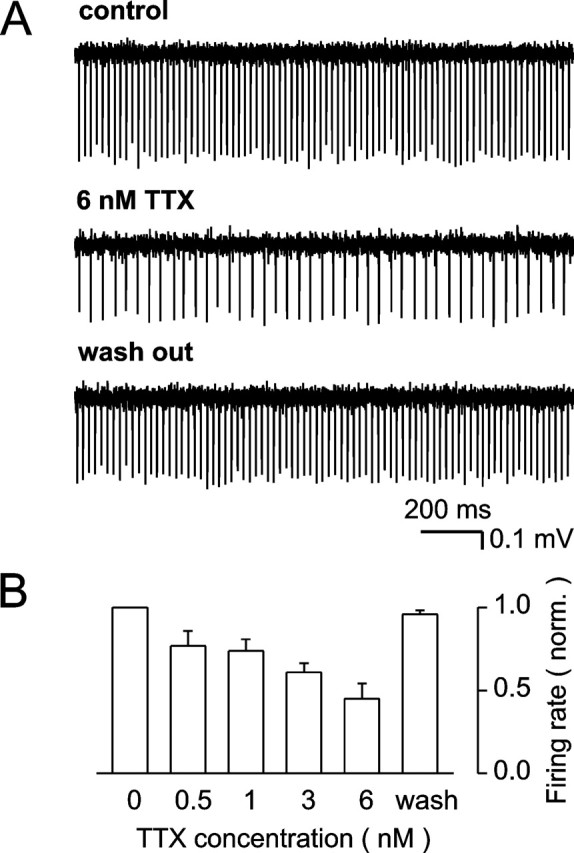
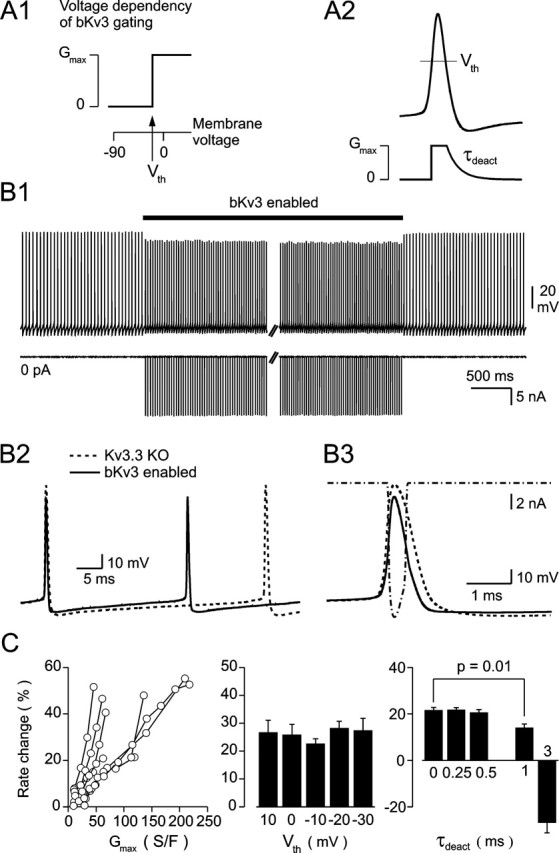
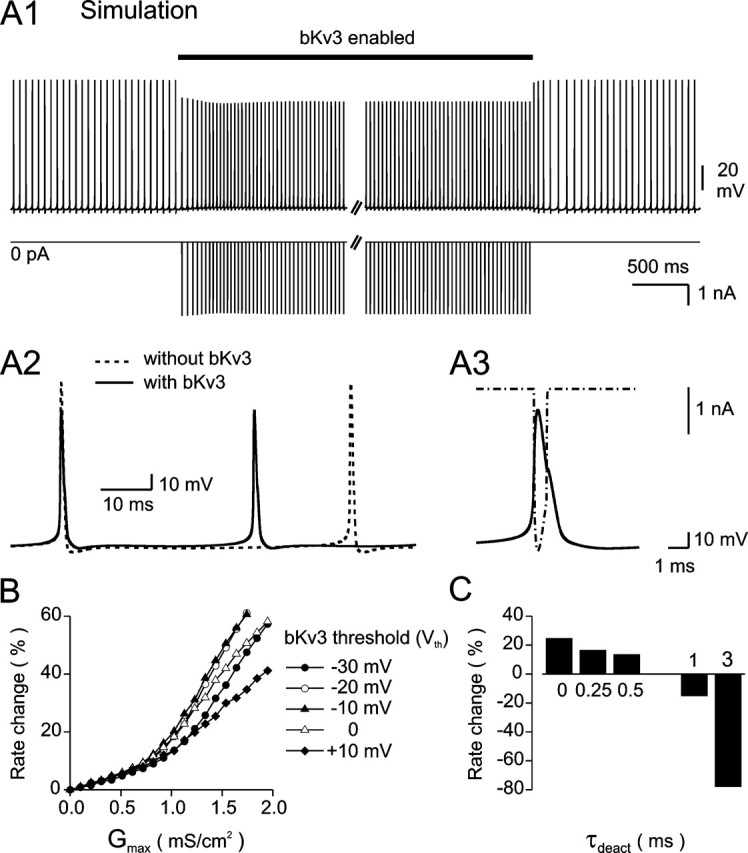
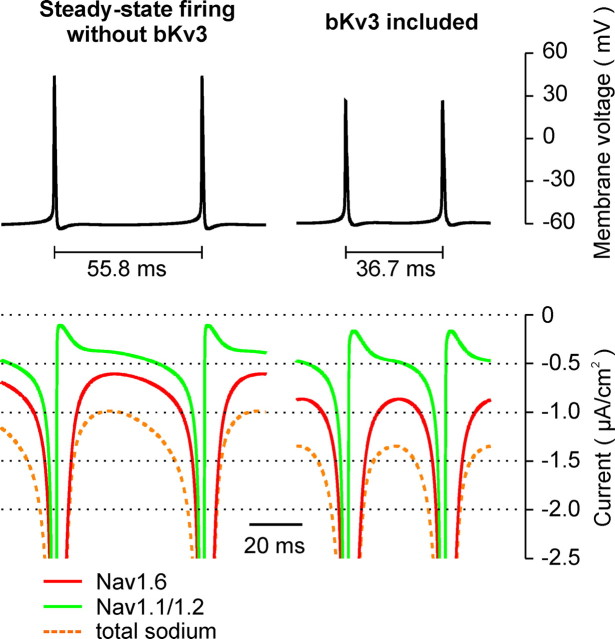
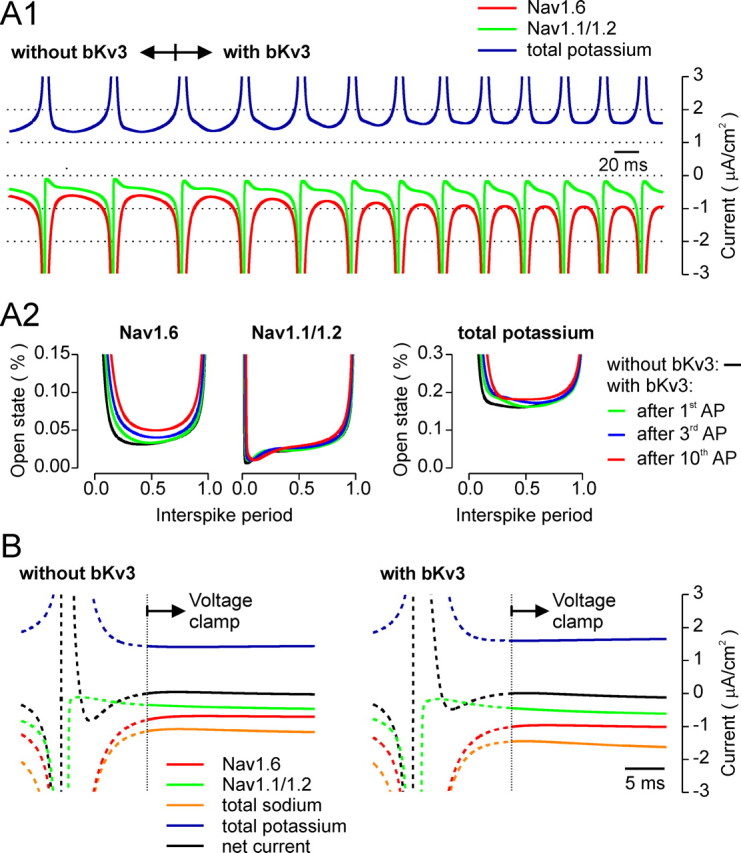
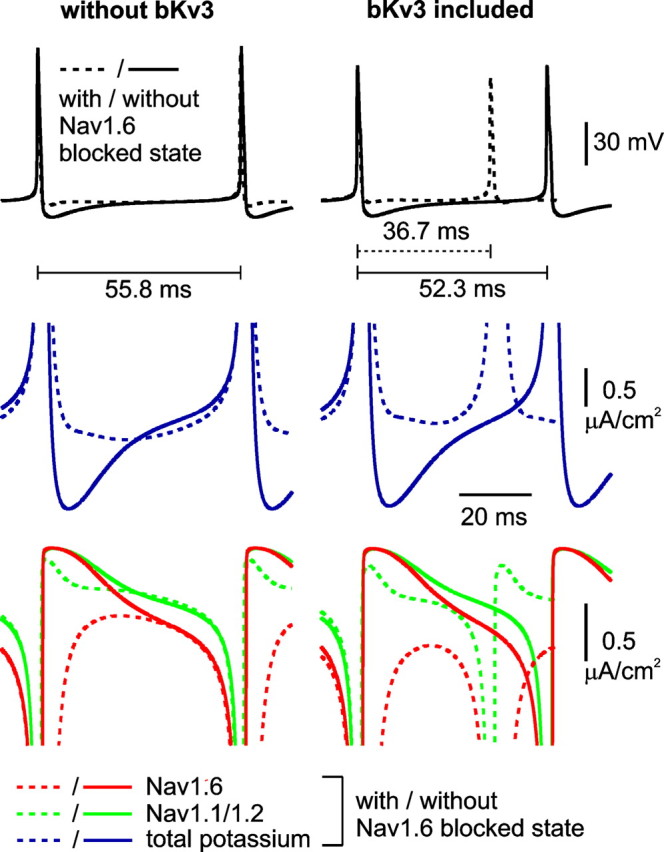
Purkinje neurons spontaneously generate action potentials in the absence of synaptic drive and thereby exert a tonic, yet plastic, input to their target cells in the deep cerebellar nuclei. Purkinje neurons express two ionic currents with biophysical properties that are specialized for high-frequency firing: resurgent sodium currents and potassium currents mediated by Kv3.3. How these ionic currents determine the intrinsic activity of Purkinje neurons has only partially been understood. Purkinje neurons from mutant mice lacking Kv3.3 have a reduced rate of spontaneous firing. Dynamic-clamp recordings demonstrated that normal firing rates are rescued by inserting artificial Kv3 currents into Kv3.3 knock-out Purkinje neurons. Numerical simulations indicated that Kv3.3 increases the spontaneous firing rate via cooperation with resurgent sodium currents. We conclude that the rate of spontaneous action potential firing of Purkinje neurons is controlled by the interaction of Kv3.3 potassium currents and resurgent sodium currents.


Figures

Figure 1.
Figure 1.
Reduced rate of spontaneous action potential firing in Kv3.3 KO Purkinje neurons. A1, Single-unit potentials were recorded from the cell bodies of a WT (top trace) and a Kv3.3 KO Purkinje neuron (bottom trace). The spike rates are 27.2 ± 0.9 Hz (WT) and 18.3 ± 0.8 Hz (Kv3.3 KO), close to the ensemble means given in B. A2, Distribution of instantaneous spike frequency of cells shown in A1. The histograms fit to the normal distribution with a correlation of R > 0.98. The widths of both distributions are not different (WT, σ/μ = 0.035 ± 0.005; Kv3.3 KO, σ/μ = 0.038 ± 0.008). B, Median spike rates measured in WT (61 cells, 11 animals, 25–51 d old; open columns) and Kv3.3 KO (52 cells, 7 animals, 30–51 d old; filled columns) Purkinje neurons at 24 ± 0.5°C. C, Spontaneous firing rate as a function of bath temperature. Columns indicate means ± SEM of firing rates measured at 25, 30, and 35°C (± 0.5°C) from WT (4 cells) and Kv3.3 KO (5 cells) Purkinje neurons. All measurements were performed in ACSF containing NBQX (20 μm) and picrotoxin (50 μm).
Figure 2.
Figure 2.
Waveforms of spontaneously generated action potentials in Kv3.3 KO and WT Purkinje neurons. A1, Grand averages of action potentials recorded intracellularly from WT (9 cells, 4 animals, 23–24 d old) and Kv3.3 KO (14 cells, 4 animals, 23–27 d old) Purkinje neurons at 24 ± 0.5°C. Traces were aligned horizontally to the action potential peaks but not aligned vertically. Vertical bars indicate SEM over different cells. A2, Grand averages of after-spike voltage trajectory recorded in WT and Kv3.3 KO cells. B, Summary of AP waveform parameters. Data points from individual cells are shown as open (WT) and filled (Kv3.3 KO) circles, and mean values are shown as horizontal lines. p values were obtained from unpaired t tests.
Figure 3.
Figure 3.
Dependence of spontaneous firing on extracellular Ca2+ concentration in WT and Kv3.3 KO Purkinje neurons. A, Rate of spontaneous firing in standard ACSF ([Ca2+] of 2 mm; open bar) and during switch to low-Ca2+/high-Mg2+ ACSF ([Ca2+] of 100 μm; filled bar). Each data point represents the median of the instantaneous rate of 20 action potentials in a recording from a representative WT (open symbols) and Kv3.3 KO (filled symbols) Purkinje neuron. B1, Spontaneous firing rate of individual cells in low-Ca2+ ACSF plotted versus firing rate in standard ACSF (WT, open symbols; Kv3.3 KO, filled symbols). The rates were determined from the median of the instantaneous spike rate during a 120 s period in control ACSF (control) and a 60 s period after the firing frequency reached a plateau in low-Ca2+ ACSF. The error bars indicate SEMs. B2, Average firing rates and SEMs of WT (12 cells; open columns) and Kv3.3 KO (12 cells; filled columns) after normalization to the baseline rate (control). All solutions contained NBQX (20 μm) and picrotoxin (50 μm).
Figure 4.
Figure 4.
Reduced rate of spontaneous firing in Purkinje neurons under low doses of TTX. A, Action potential firing of a WT Purkinje neuron under control conditions, 20 min after application of 6 nm TTX, and after washout of TTX. B, Averaged spike frequency, normalized to control, in the presence of increasing concentrations of TTX (0.5, 1, 3, and 6 nm). Data are from four cells. Solutions contained NBQX (20 μm) and picrotoxin (50 μm).
Figure 5.
Figure 5.
Rescue of the WT firing rate in Kv3.3 KO Purkinje neurons by an artificial Kv3 conductance in dynamic clamp. A1, Conductance–voltage relationship of the Kv3 model (bKv3) used in the dynamic-clamp experiment. The threshold voltage (Vth) is indicated by an arrow. A2, Schematic illustration of bKv3 conductance during an action potential. B1, Two-electrode dynamic-clamp recording with a bKv3 conductance model (Gmax = 210 S/F; Vth = −10 mV; instantaneous deactivation) applied to a Kv3.3 KO Purkinje cell (zero holding current). Top trace, Membrane voltage recorded with the first electrode. Bottom trace, Current passing through the second electrode. The black horizontal bar indicates the time period when the dynamic-clamp mode was enabled. B2, Traces of two consecutive action potentials during baseline firing (dashed curve) and with the bKv3 conductance enabled (solid curve). The two traces were horizontally aligned at the peak of the first action potential. B3, Action potential shape during baseline firing (dashed curve) and under bKv3 dynamic clamp (solid curve) together with the injected current (dash-dotted curve) at higher temporal resolution. C, Left, Shift in spontaneous firing rate as a function of Gmax (Vth = −10 mV). Data from individual cells are connected by lines (one- and two-electrode recordings). Middle, bKv3-induced change of firing rates obtained with different threshold voltages Vth (Gmax = 53 ± 8 S/F; 9 cells; one-electrode recordings). Right, Change of firing rate obtained with different deactivation time constants τdeact (Gmax = 73 ± 22 S/F; Vth = −10 mV; 7 cells; one-electrode recordings).
Figure 6.
Figure 6.
Computational simulation of dynamic-clamp experiments illustrated in Figure 5. A1, Spontaneous action potentials with and without bKv3 conductance (Gmax = 1.6 mS/cm2; Vth = −10 mV). Top trace, Membrane voltage. Bottom trace, bKv3 current. bKv3 was enabled during the period indicated by a black horizontal bar on top of the figure. A2, Two consecutive action potentials in simulations without (dashed curve) and with (solid curve; Gmax = 1.6 mS/cm2; Vth = −10 mV) bKv3. Traces are horizontally aligned at the peak of the first action potential. A3, A single action potential in the simulation including bKv3 (solid curve, membrane voltage; dash-dotted curve, bKv3 current). B, Change of steady-state firing rate as function of the maximum bKv3 conductance (Gmax) for threshold voltages from −30 to +10 mV. C, Change of stationary firing rate by a Kv3 model with deactivation constants between 0 and 3 ms (Gmax = 1.1 mS/cm2; Vth = −10 mV).
Figure 7.
Figure 7.
Effect of bKv3 on Na+ currents flowing during the interspike interval. Simulations of steady-state spontaneous firing without (left) and with (right) bKv3 conductance (Gmax = 1.6 mS/cm2; Vth = −10 mV).
Figure 8.
Figure 8.
Time dependence of activation of tonic interspike currents by Kv3. A1, Simulation of interspike membrane currents before and after addition of bKv3 conductance (Gmax = 1.6 mS/cm2; Vth = −10 mV). A2, Open-state probabilities of Nav1.6, Nav1.1/1.2, and total potassium conductance plotted against interspike period before enabling bKv3 (black traces) and after the first (green), third (blue), and 10th (red) action potential with bKv3 activated. B, Simulation of membrane currents after an action potential without bKv3 (left) and after (right) activation of bKv3 for 10 action potentials (Gmax = 1.6 mS/cm2; Vth = −10 mV). From the time point when the net current crosses the zero line (indicated by a dashed vertical line), the simulation was continued in voltage clamp with the voltage fixed to −60.5 mV (without bKv3) and −59.2 mV (with bKv3). Current transients under voltage clamp are displayed as solid lines; currents with unclamped voltage are displayed as dotted lines.
Figure 9.
Figure 9.
Role of the blocked state of Nav1.6 in Kv3-dependent intrinsic activity. Simulations without (left) and with (right) bKv3 conductance (Gmax = 1.6 mS/cm2; Vth = −10 mV) in the presence (dashed traces) and absence (solid traces) of a blocked state in the Nav1.6 model. At the top are voltage transients with the interspike interval represented by horizontal lines. The bottom shows ionic currents as indicated in the legend. The simulations without blocked state in the Nav1.6 model included a 32 nA/cm2 holding current.

References

    1. Armstrong DM, Rawson JA (1979). Activity patterns of cerebellar cortical neurons and climbing fibre afferents in the awake cat. J Physiol (Lond) 289:425–448. - PMC - PubMed
    1. Atzori M, Lau D, Tansey EP, Chow A, Ozaita A, Rudy B, McBain CJ (2000). H2 histamine receptor-phosphorylation of Kv3.2 modulates interneuron fast spiking. Nat Neurosci 3:791–798. - PubMed
    1. Bal T, McCormick DA (1997). Synchronized oscillations in the inferior olive are controlled by the hyperpolarization-activated cation current I(h). J Neurophysiol 77:3145–3156. - PubMed
    1. Behnisch T, Matsushita S, Knöpfel T (2004). Imaging of gene expression during long-term potentiation. NeuroReport 15:2039–2043. - PubMed
    1. Benardo LS, Foster RE (1986). Oscillatory behavior in inferior olive neurons: mechanism, modulation, cell aggregates. Brain Res Bull 17:773–784. - PubMed

Publication types