. 2006 Apr 26;26(17):4613-23.
doi: 10.1523/JNEUROSCI.0064-06.2006.

Hyperexcitability, interneurons, and loss of GABAergic synapses in entorhinal cortex in a model of temporal lobe epilepsy

Affiliations

Hyperexcitability, interneurons, and loss of GABAergic synapses in entorhinal cortex in a model of temporal lobe epilepsy

Sanjay S Kumar et al. J Neurosci. .

Abstract

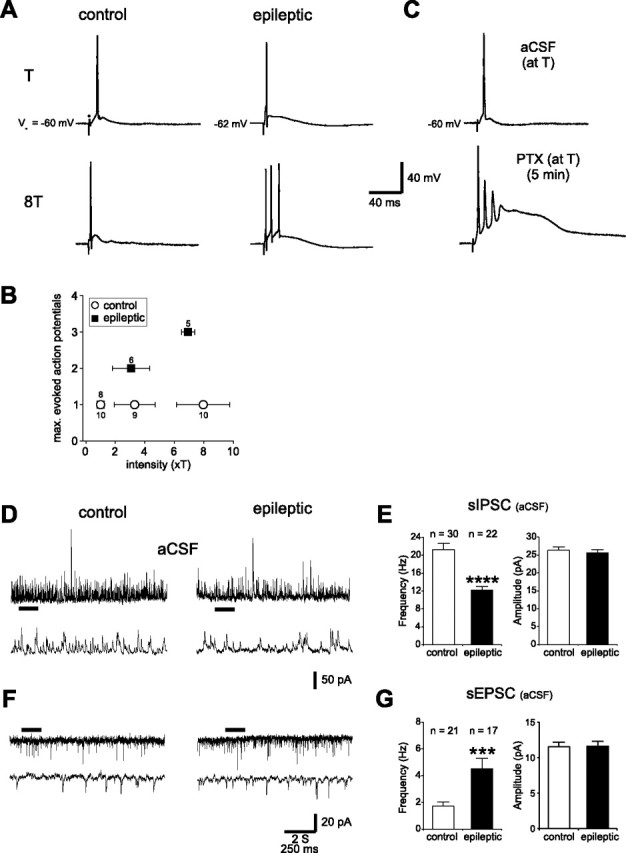
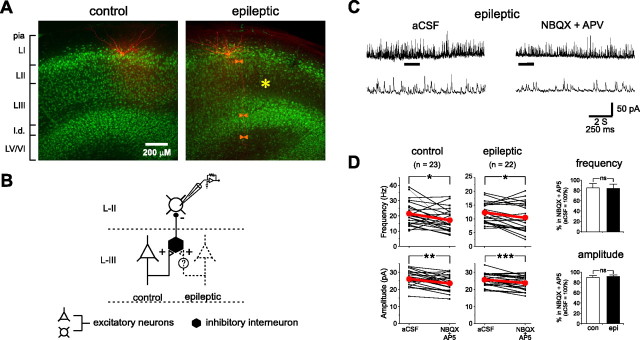
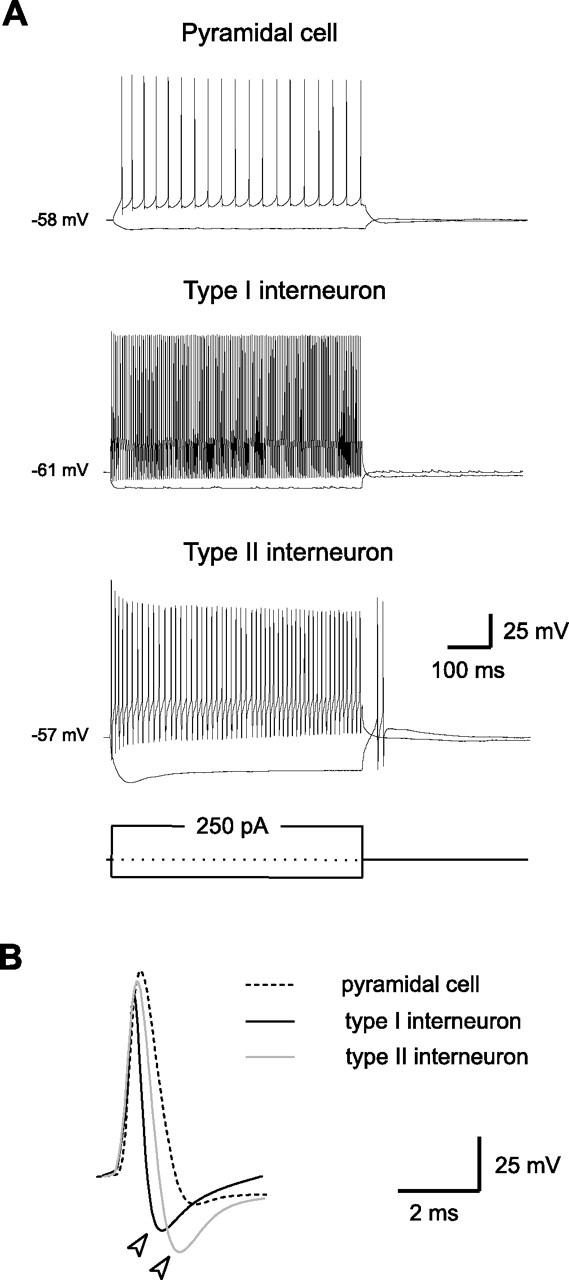
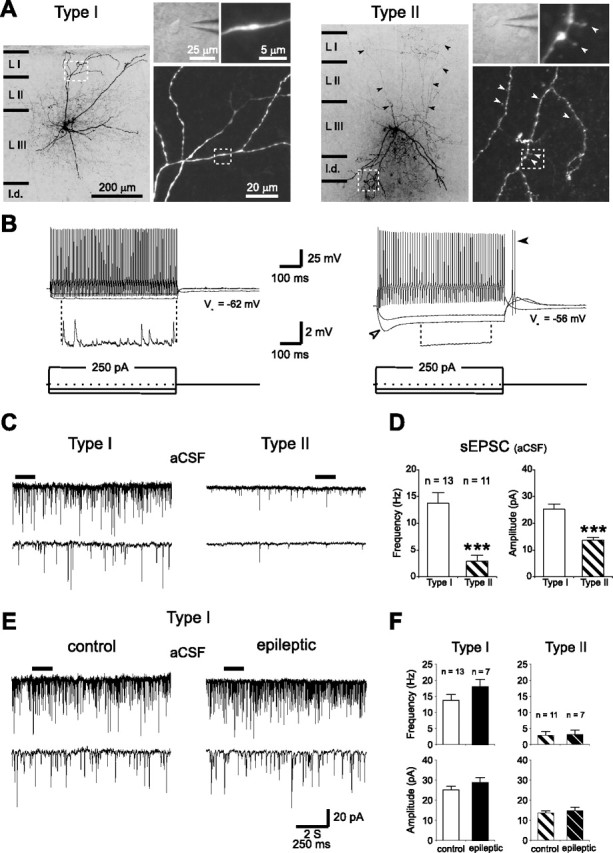
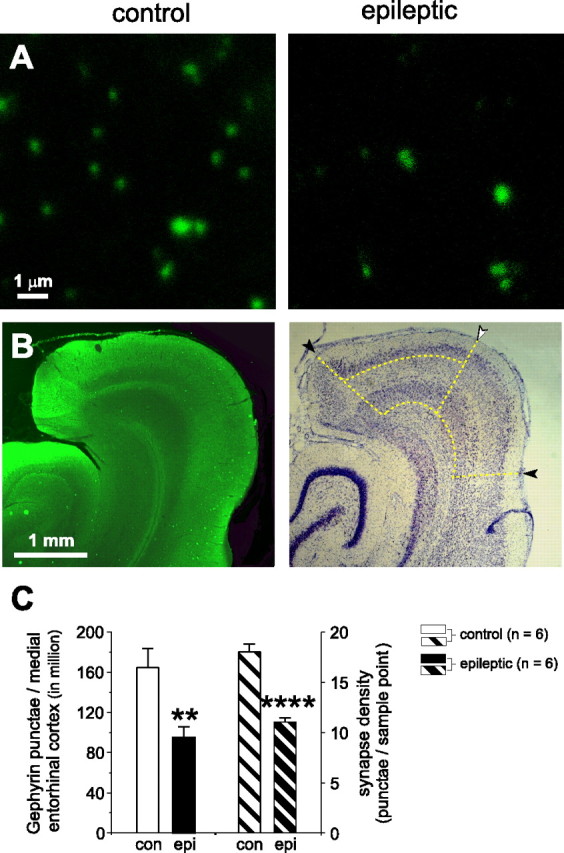
Temporal lobe epilepsy is the most common type of epilepsy in adults, and its pathophysiology remains unclear. Layer II stellate cells of the entorhinal cortex, which are hyperexcitable in animal models of temporal lobe epilepsy, provide the predominant synaptic input to the hippocampal dentate gyrus. Previous studies have ascribed the hyperexcitability of layer II stellate cells to GABAergic interneurons becoming "dormant" after disconnection from their excitatory synaptic inputs, which has been reported to occur during preferential loss of layer III pyramidal cells. We used whole-cell recording from slices of entorhinal cortex in pilocarpine-treated epileptic rats to test the dormant interneuron hypothesis. Hyperexcitability appeared as multiple action potentials and prolonged depolarizations evoked in layer II stellate cells of epileptic rats but not controls. However, blockade of glutamatergic synaptic transmission caused similar percentage reductions in the frequency of spontaneous IPSCs in layer II stellate cells of control and epileptic rats, suggesting similar levels of excitatory synaptic input to GABAergic interneurons. Direct recordings and biocytin labeling revealed two major types of interneurons in layer III whose excitatory synaptic drive in epileptic animals was undiminished. Interneurons in layer III did not appear to be dormant; therefore, we tested whether loss of GABAergic synapses might underlie hyperexcitability of layer II stellate cells. Stereological evidence of fewer GABAergic interneurons, fewer gephyrin-immunoreactive punctae, and reduced frequency of spontaneous IPSCs and miniature IPSCs (recorded in tetrodotoxin) confirmed that layer II stellate cell hyperexcitability is attributable, at least in part, to reduced inhibitory synaptic input.


Figures

Figure 1.
Figure 1.
Hyperexcitability of layer II stellate cells in the medial entorhinal cortex of epileptic rats and comparison of spontaneous PSCs between control and epileptic groups. A, Current-clamp recordings of layer II cells (at the indicated resting membrane potentials, Vm). Action potentials were evoked by stimulating fibers in layer I with a single brief current pulse at the T for evoking an action potential and at a multiple of T. The stimulus artifact (•) is shown truncated in all traces. B, Scatter plot of the maximum number of action potentials that could be evoked as a function of stimulus intensity. Numbers by the symbols indicate cells tested in the respective groups. Error bars indicate ±SEM of stimulus intensities. C, Bath application of picrotoxin (PTX, 50 μm) to layer II stellate cells (n = 4) in the control group produced effects similar to increasing stimulus intensity in the epileptic group. D, E, sIPSCs (outward events at 0 mV holding potential) of layer II stellate cells in control and epileptic rats recorded in normal aCSF. Bottom traces show time-expanded views of the regions indicated by bars in the top traces in these and all subsequent figures. Bar plots show the mean frequency and amplitude of the events in the indicated number of cells. Error bars indicate SEM (F, G). Records and corresponding bar plots of sEPSCs (inward events at −60 mV holding potential) recorded in layer II stellate cells. Error bars indicate SEM. ∗∗∗p < 0.001, ∗∗∗∗p < 0.0001, t test.
Figure 2.
Figure 2.
A pharmacological test indicates that interneurons are not disconnected from excitatory synaptic input in the medial entorhinal cortex of epileptic rats. A, The medial entorhinal cortex in control and pilocarpine-treated epileptic rats. Recorded neurons were identified morphologically by biocytin labeling (red). Counterstaining for NeuN immunoreactivity (green) revealed the layers of the medial entorhinal cortex (LI–LVI; l.d., lamina dissecans) and the loss of layer III neurons in the epileptic rat (∗). Arrowheads in the epileptic slice point to the primary axon of the recorded layer II stellate cell. B, The schematic diagram illustrates the dormant interneuron hypothesis of layer II stellate cell hyperexcitability. In epileptic animals, inhibitory interneurons in layer III are hypothesized to become less active after being “disconnected” from a normal source of excitatory synaptic input: layer III pyramidal cells. This model predicts that the frequency of sIPSCs (but not mIPSCs) in layer II stellate cells will be reduced and be less sensitive to glutamate receptor blockade in epileptic rats. C, Records of sIPSCs from a layer II stellate cell of an epileptic animal in normal aCSF and after bath application of glutamatergic receptor blockers (10 μm NBQX and 50 μm d-APV). Note the reduction in sIPSC frequency. D, A comparison between control (con) and epileptic (epi) groups of the changes in sIPSC frequency and amplitude affected by glutamatergic blockers. Thin black lines are data from individual cells. Thick red lines are group averages. Similar percentage reductions occur in the control and epileptic groups. Error bars indicate SEM. ∗p < 0.05, ∗∗p < 0.005, ∗∗∗p < 0.001, paired t test. ns, Not statistically significant; p > 0.7, t test.
Figure 3.
Figure 3.
Active and passive electrophysiological properties of interneurons and pyramidal cells in layer III of the medial entorhinal cortex. A, A comparison of the action potential firing properties of interneurons and pyramidal cells in response to current injections at their respective resting membrane potentials. B, Single action potential attributes of interneurons and a pyramidal cell. Arrowheads indicate the spike afterhyperpolarization.
Figure 4.
Figure 4.
Anatomical and electrophysiological features of the two dominant types of inhibitory interneurons in layer III of the medial entorhinal cortex and their excitatory synaptic drive. A, Typical biocytin-labeled type I and type II interneurons showing differences in the orientation of their dendrites (thicker branches). The axon projections (thinner branches) of the two cell types are different: confined to the vicinity of the cell body and extending into layer II for type I and projecting to and ramifying in layer I for type II (black arrowheads). Magnified views of the boxed regions are shown on the right and in insets (top) of the respective figures, illustrating dendritic spines (white arrowheads) on type II interneurons but not type I interneurons. Differences in the shape of the cell bodies are subtle but distinguishable when examined with infrared differential-interference contrast optics (top inset). LI–LIII, Layers of the medial entorhinal cortex; l.d., lamina dissecans. B, Differences in the firing properties of the two cell types (at the indicated resting membrane potential) in response to current injections. Note the presence of spontaneous postsynaptic potentials in type I interneurons that are seldom seen in type II. Prominent sag currents (open arrowhead) and rebound burst firing (filled arrowhead) could be seen only in type II interneurons. C, D, A comparison of sEPSCs recorded at −60 mV in normal aCSF in both types of interneurons from control rats. Bar plots show a smaller average frequency and amplitude of sEPSCs in type II interneurons compared with type I interneurons. Error bars indicate SEM. ∗∗∗p < 0.001, t test. E, F, There are no differences in mean frequency or amplitude of sEPSCs in epileptic rats compared with controls for either type of interneuron.
Figure 5.
Figure 5.
Electrophysiological evidence for loss of inhibitory synaptic input to layer II stellate cells in the medial entorhinal cortex of epileptic rats. A, Miniature IPSCs recorded in layer II stellate cells show reduced frequency in the epileptic group compared with controls. B, Averaged cumulative distributions of interevent intervals (left; bin size, 20 ms) and amplitudes (right; bin size, 2 pA) of mIPSCs recorded in layer II stellate cells from control and epileptic rats averaged over the indicated number of cells in each group. Bar plots (insets) represent the pooled data. Error bars indicate SEM. ∗∗p < 0.01, t test.
Figure 6.
Figure 6.
Anatomical evidence for loss of inhibitory synaptic input to layer II stellate cells in the entorhinal cortex of epileptic rats. A, Images acquired by a laser scanning confocal microscopy of individual sample points in gephyrin-stained sections through the entorhinal cortex of control and epileptic rats. Each image is a composite of seven optical sections in the Z plane. B, A low-powered image of the section used to acquire the control image in A. Adjacent Nissl-stained sections provided laminar information (right). Black arrowheads indicate the borders of the entorhinal cortex at the pail surface. A white arrowhead indicates the border of the medial and lateral entorhinal cortex. Dashed lines indicate the borders of the medial and lateral entorhinal cortex and layers I–II of the medial entorhinal cortex. C, Pooled data of the number of gephyrin-positive punctae/entorhinal cortex (layers I–II only) averaged from the indicated number of animals in each group along with corresponding synapse density. con, Control rats; epi, epileptic rats. Error bars indicate SEM. ∗∗p < 0.01, ∗∗∗∗p ≪ 0.001, t test.
Figure 7.
Figure 7.
Stereological evidence for loss of GABAergic interneurons in the entorhinal cortex of epileptic rats. A, Images of control (left) and epileptic (right) Nissl-stained sections reveal preferential loss (∗) of layer III pyramidal cells. Layers are indicated (LI–LVI; l.d., lamina dissecans). B1, Adjacent sections from the same animals processed for GAD65 mRNA in situ hybridization. B2, Higher-magnification images of the regions indicated by boxes in B1. C, Epileptic animals had fewer Nissl-stained neurons and GAD-positive cells in all layers of the entorhinal cortex. ∗p < 0.05, ∗∗p < 0.01, ∗∗∗p < 0.005, ∗∗∗∗p < 0.001, t test.

References

    1. Agrawal N, Alonso A, Ragsdale DS (2003). Increased persistent sodium currents in rat entorhinal cortex layer V neurons in a post-status epilepticus model of temporal lobe epilepsy. Epilepsia 44:1601–1604. - PubMed
    1. Alonso A, Klink R (1993). Differential electroresponsiveness of stellate and pyramidal-like cells of medial entorhinal cortex layer II. J Neurophysiol 70:128–143. - PubMed
    1. Bartolomei F, Khalil M, Wendling F, Sontheimer A, Régis J, Ranjeva J-P, Guye M, Chauvel P (2005). Entorhinal cortex involvement in human mesial temporal lobe epilepsy: an electrophysiological and volumetric study. Epilepsia 45:677–687. - PubMed
    1. Bear J, Fountain NB, Lothman EW (1996). Responses of the superficial entorhinal cortex in vitro in slices from naive and chronically epileptic rats. J Neurophysiol 76:2928–2940. - PubMed
    1. Bekenstein JW, Lothman EW (1993). Dormancy of inhibitory interneurons in a model of temporal lobe epilepsy. Science 259:97–100. - PubMed

Publication types

LinkOut - more resources