

A reliable phenotype predictor for human immunodeficiency virus type 1 subtype C based on envelope V3 sequences
- PMID: 16641263
- PMCID: PMC1472078
- DOI: 10.1128/JVI.80.10.4698-4704.2006
A reliable phenotype predictor for human immunodeficiency virus type 1 subtype C based on envelope V3 sequences
Abstract
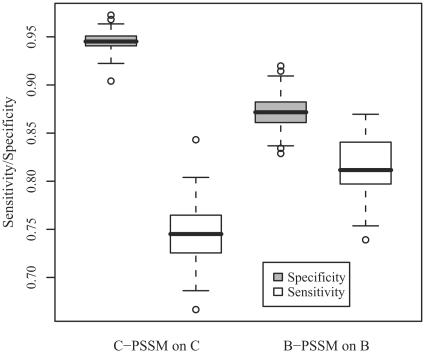
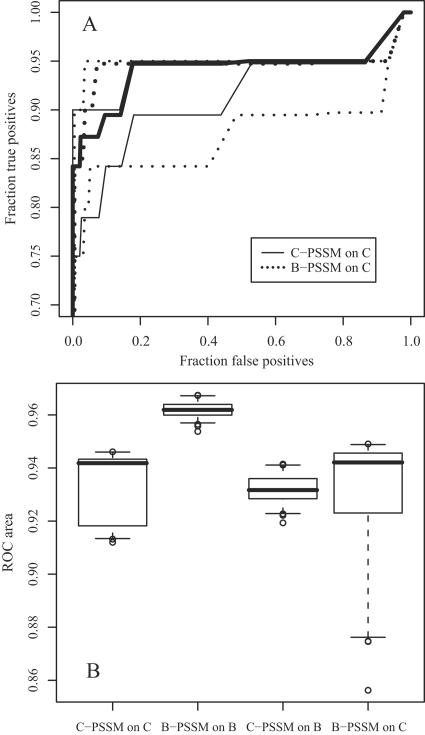
In human immunodeficiency virus type 1 (HIV-1) subtype B infections, the emergence of viruses able to use CXCR4 as a coreceptor is well documented and associated with accelerated CD4 decline and disease progression. However, in HIV-1 subtype C infections, responsible for more than 50% of global infections, CXCR4 usage is less common, even in individuals with advanced disease. A reliable phenotype prediction method based on genetic sequence analysis could provide a rapid and less expensive approach to identify possible CXCR4 variants and thus increase our understanding of subtype C coreceptor usage. For subtype B V3 loop sequences, genotypic predictors have been developed based on position-specific scoring matrices (PSSM). In this study, we apply this methodology to a training set of 279 subtype C sequences of known phenotypes (228 non-syncytium-inducing [NSI] CCR5(+) and 51 SI CXCR4(+) sequences) to derive a C-PSSM predictor. Specificity and sensitivity distributions were estimated by combining data set bootstrapping with leave-one-out cross-validation, with random sampling of single sequences from individuals on each bootstrap iteration. The C-PSSM had an estimated specificity of 94% (confidence interval [CI], 92% to 96%) and a sensitivity of 75% (CI, 68% to 82%), which is significantly more sensitive than predictions based on other methods, including a commonly used method based on the presence of positively charged residues (sensitivity, 47.8%). A specificity of 83% and a sensitivity of 83% were achieved with a validation set of 24 SI and 47 NSI unique subtype C sequences. The C-PSSM performs as well on subtype C V3 loops as existing subtype B-specific methods do on subtype B V3 loops. We present bioinformatic evidence that particular sites may influence coreceptor usage differently, depending on the subtype.
Figures


References
-
- Armitage, P., G. Berry, and J. N. S. Matthews. 2002. Statistical methods in medical research, 4th ed. Blackwell Scientific Publications, Oxford, United Kingdom.
-
- Berger, E. A., R. W. Doms, E. M. Fenyo, B. T. Korber, D. R. Littman, J. P. Moore, Q. J. Sattentau, H. Schuitemaker, J. Sodroski, and R. A. Weiss. 1998. A new classification for HIV-1. Nature 391:240. - PubMed
-
- Bjorndal, A., A. Sonnerborg, C. Tscherning, J. Albert, and E. M. Fenyo. 1999. Phenotypic characteristics of human immunodeficiency virus type 1 subtype C isolates of Ethiopian AIDS patients. AIDS Res. Hum. Retrovir. 15:647-653. - PubMed
-
- Briggs, D. R., D. L. Tuttle, J. W. Sleasman, and M. M. Goodenow. 2000. Envelope V3 amino acid sequence predicts HIV-1 phenotype (co-receptor usage and tropism for macrophages). AIDS 14:2937-2939. - PubMed
-
- Brumme, Z. L., W. W. Dong, B. Yip, B. Wynhoven, N. G. Hoffman, R. Swanstrom, M. A. Jensen, J. I. Mullins, R. S. Hogg, J. S. Montaner, and P. R. Harrigan. 2004. Clinical and immunological impact of HIV envelope V3 sequence variation after starting initial triple antiretroviral therapy. AIDS 18:F1-F9. - PubMed
Publication types
MeSH terms
Substances
Grants and funding
LinkOut - more resources
Full Text Sources
Other Literature Sources
Research Materials
