. 2006 Jul;17(7):3156-75.
doi: 10.1091/mbc.e05-08-0799. Epub 2006 Apr 26.

Rab10 regulates membrane transport through early endosomes of polarized Madin-Darby canine kidney cells

Affiliations

Rab10 regulates membrane transport through early endosomes of polarized Madin-Darby canine kidney cells

Clifford M Babbey et al. Mol Biol Cell. 2006 Jul.

Abstract

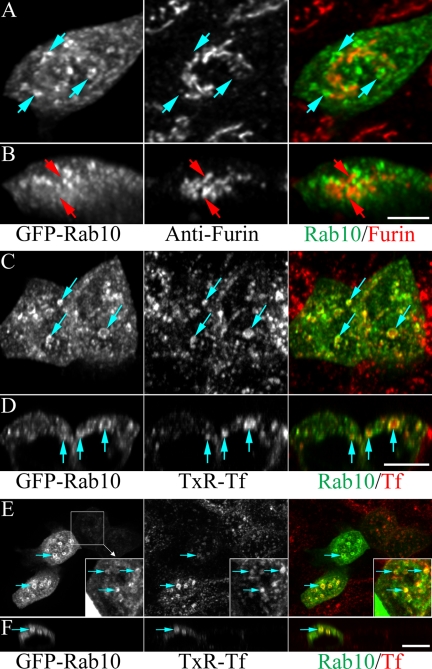
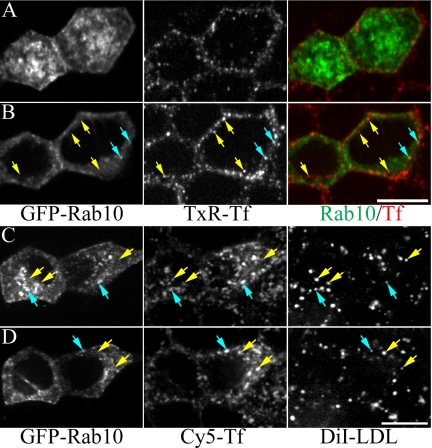
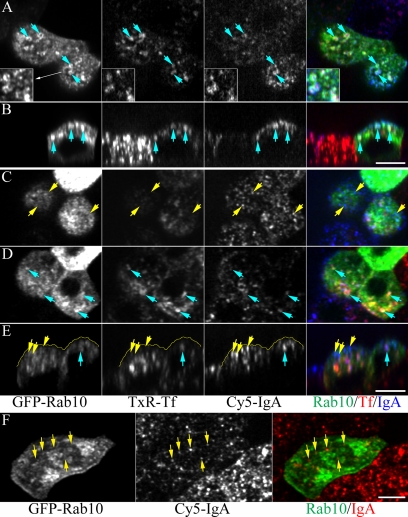
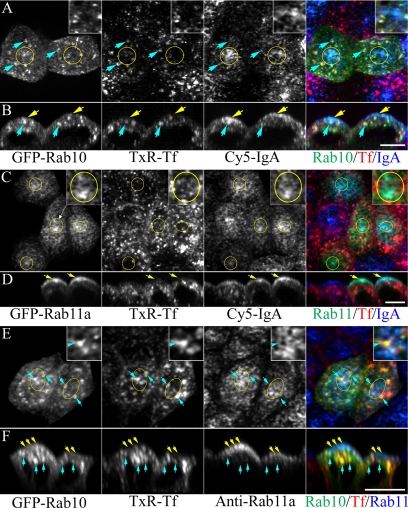
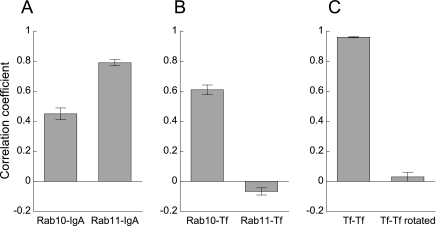
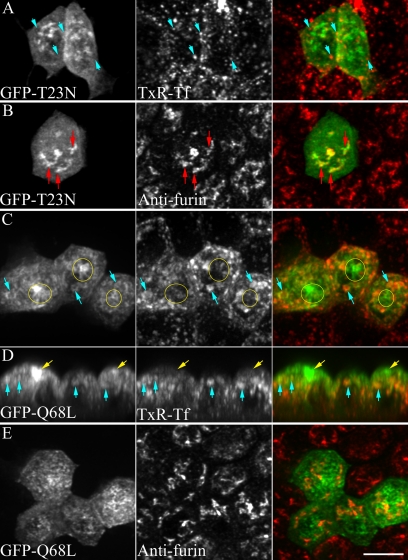
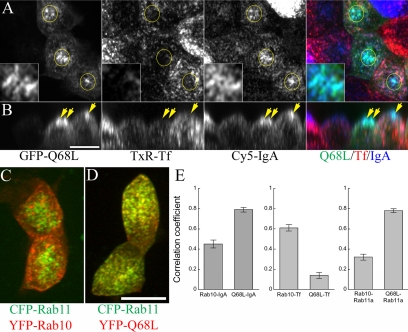
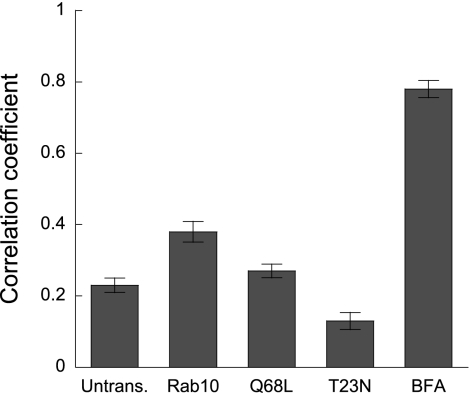
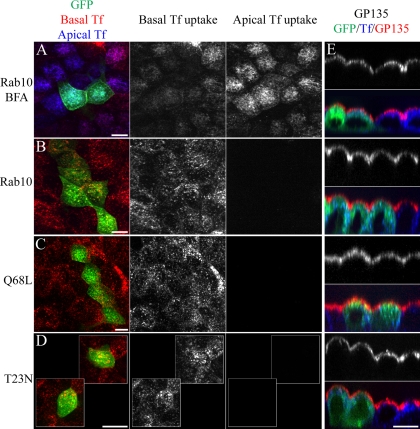
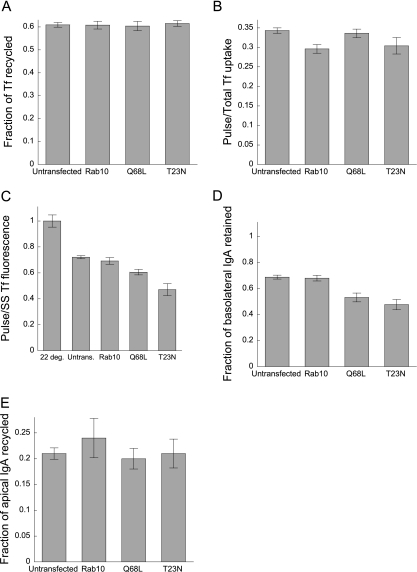
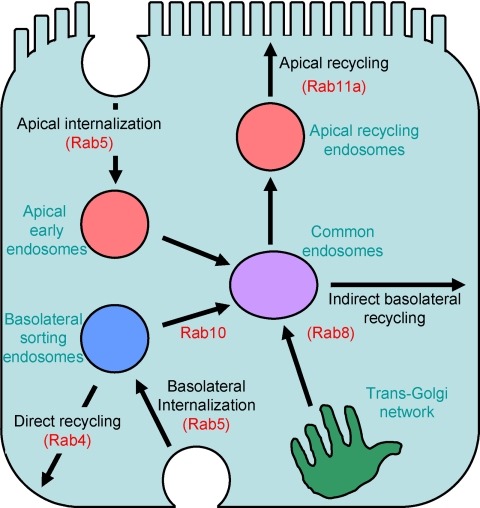
Rab10, a protein originally isolated from Madin-Darby Canine Kidney (MDCK) epithelial cells, belongs to a family of Rab proteins that includes Rab8 and Rab13. Although both Rab8 and Rab13 have been found to mediate polarized membrane transport, the function of Rab10 in mammalian cells has not yet been established. We have used quantitative confocal microscopy of polarized MDCK cells expressing GFP chimeras of wild-type and mutant forms of Rab10 to analyze the function of Rab10 in polarized cells. These studies demonstrate that Rab10 is specifically associated with the common endosomes of MDCK cells, accessible to endocytic probes internalized from either the apical or basolateral plasma membrane domains. Expression of mutant Rab10 defective for either GTP hydrolysis or GTP binding increased recycling from early compartments on the basolateral endocytic pathway without affecting recycling from later compartments or the apical recycling pathway. These results suggest that Rab10 mediates transport from basolateral sorting endosomes to common endosomes.


Figures

Figure 1.
Figure 1.
GFP-Rab10 associates with endosomes and not with the TGN of polarized MDCK cells. (A and B) Cells expressing GFP-Rab10 were processed for immunofluorescence using an anti-furin antibody. Three-dimensional image volumes were collected, one of which is presented as a single projection of the collected images (XY projection, A) or as an XZ projection of a subset of vertical sections through the cells (B). The projections are combined into a single color image in the third column, with GFP shown in green and furin immunofluorescence shown in red. Blue arrows indicate GFP-Rab10 associated with vesicular compartments lacking furin immunofluorescence, whereas red arrows in the XZ projection indicate furin compartments lacking GFP-Rab10. (C and D) Cells expressing GFP-Rab10 were incubated in basolateral TxR-Tf for 20 min before fixation and 3D imaging. A close correspondence between the two can be seen in both the XY and XZ projections (C and D, respectively). Arrows indicate a few examples of GFP-Rab10 (green) associated with compartments containing internalized TxR-Tf (red). Volume renderings of the cells shown in these figures are shown in Video 1. (E and F) XY and XZ projections of a field of cells similar to those in C, but expressing different levels of GFP-Rab10, showing that the association of GFP-Rab10 with Tf-containing endosomes is independent of the level of GFP-Rab10 expression over a fourfold range. The inset is a 2× magnification whose contrast has been enhanced to display the weak GFP fluorescence. Scale bars, 5 μm (A and B) or 10 μm (C–F).
Figure 2.
Figure 2.
GFP-Rab10 associates with a small fraction of basolateral sorting endosomes. Cells expressing GFP-Rab10 were incubated in basolateral TxR-Tf for 2 min and fixed and 3D image volumes were collected. (A) An optical section collected from the apical region of the cells. (B) An optical section collected ∼4 μm lower in the cells. Although GFP-Rab10 (green) is associated with punctate structures, it is largely absent from the sharply punctate lateral compartments containing internalized TxR-Tf (red). Yellow arrows indicate lateral compartments containing Tf but not Rab10, and blue arrows indicate compartments containing both. (C and D) Cells expressing GFP-Rab10 were incubated with diI-LDL and Cy5-Tf for 20 min and fixed, and 3D image volumes were collected. Projections of a 2-μm-thick region and a 4-μm-thick region lower in the cells are shown in C and D, respectively. Arrows indicate sorting endosomes, containing both Tf and LDL, and blue arrows indicate sorting endosomes also associated with GFP-Rab10. Scale bar, 10 μm.
Figure 3.
Figure 3.
GFP-Rab10 associates with common endosomes accessible to apically internalized IgA. (A and B) Cells expressing GFP-Rab10 (green) were incubated with basal TxR-Tf and apical Cy5-IgA for 20 min. A projection of three subapical focal planes is presented in A, and a projection of vertical sections from the lower part of the field is presented in B. A large fraction of the Tf-containing endosomes with which GFP-Rab10 associates also contain apically internalized IgA, of few of which are indicated with blue arrows. (C–E) Cells expressing GFP-Rab10 (green) were incubated for 14 min with TxR-Tf on the basal side, with Cy5-IgA present on the apical side of the monolayer for the final 4 min. Projections of images collected at the top (A) and middle (B) regions of the cells show that apically internalized IgA is largely found in sharply punctate compartments at the apex of the cells. These compartments, some of which are indicated with yellow arrows, lack GFP-Rab10 and TxR-Tf, an observation that is especially apparent in the XZ sections of two cells presented in C. Blue arrows indicate GFP-Rab10 associated with Tf-containing endosomes. (F) Cells expressing GFP-Rab10 (green) were incubated with Cy5-IgA (red) on the apical side of the monolayer for 4 min, incubated with 100 μg/ml trypsin at 4°, and then fixed. As in the previous figures, apically internalized IgA is largely distributed in sharply punctate endosomes that lack GFP-Rab10 (some of which are indicated with arrows). Scale bars, 10 μm.
Figure 4.
Figure 4.
GFP-Rab10 is not associated with the ARE. (A and B) Cells expressing GFP-Rab10 were incubated with TxR-Tf and Cy5-IgA in the basolateral medium for 20 min and fixed. As in previous figures, GFP-Rab10 associates with endosomes containing TxR-Tf, some of which are indicated with blue arrows. However, the preponderance of the Cy5-IgA fluorescence is concentrated in the ARE, which lacks both GFP-Rab10 and TxR-Tf, indicated with yellow circles in the XY projections (A) and with yellow arrows in the XZ projections (B). The 2× magnification of the ARE region of one of the cells clearly shows that Cy5-IgA accumulated in compartments lacking GFP-Rab10 and TxR-Tf. (C and D). Cells were labeled as in A and B, except that they were transfected with GFP-Rab11a, which has been shown to closely associate with the ARE. In this case, a close correspondence is found between the distribution of GFP-Rab11a and Cy5-IgA, particularly in the regions of the ARE, as indicated with yellow circles in the XY projections (C) and yellow arrows in the XZ projections (D). As in the previous figure, TxR-Tf is absent from these compartments. The different distribution of TxR-Tf compared with GFP-Rab11a and Cy5-IgA in the ARE of one of the cells is emphasized in the 2× inset in C. (E and F) The distributions of GFP-Rab10 and Rab11a were compared by transfecting cells with GFP-Rab10, incubating them with TxR-Tf, and then processing them for Rab11a immunofluorescence. The colocalization of GFP-Rab10 and TxR-Tf in common endosomes, and their absence from Rab11a-associated AREs is shown in XY projections (E) and XZ projections (F). The inset in E shows a 2× magnification of one of the cells. Scale bars, 10 μm.
Figure 5.
Figure 5.
Image cross-correlation analysis of the distributions of GFP-Rab10 and GFP-Rab11a relative to basolaterally internalized Tf and IgA. (A) Correlation analysis comparing the distribution of Cy5-IgA with either GFP-Rab10 or GFP-Rab11a in the ARE region from projected 3D image volumes collected of transfected cells labeled for 20 min with Cy5-IgA. The distribution of Cy5-IgA is much more highly correlated with the ARE-associated GFP-Rab11a (r = 0.79, n = 31) than with GFP-Rab10 (r = 0.45, n = 22). (B) The opposite relationship is found for internalized TxR-Tf, which is more highly associated with GFP-Rab10 (r = 0.61, n = 22), than with GFP-Rab11a (r = −0.067, n = 20). (C) The validity of the correlation analysis was verified in samples labeled for 20 min with TxR-Tf and Cy5-Tf, which provide a sample with nearly perfect colocalization. In this case the correlation between TxR-Tf and Cy5-Tf averaged 0.96 (n = 20). Random correlation was modeled by rotating the image of Cy5-Tf 90° before comparison with its partner. In this case, the correlation between the two images averaged 0.03 (n = 20). Differences in all three comparisons were statistically significant, with p ≪ 0.0001. Data are presented as means ± SEM.
Figure 6.
Figure 6.
Compartmental localization is altered in GTP-hydrolysis and GTP-binding mutant forms of Rab10. (A) Polarized MDCK cells expressing GFP-Rab10-T23N were incubated for 20 min with TxR-Tf (red) and fixed. Unlike wild-type Rab10, the T23N mutant form of GFP-Rab10 localizes to tubular compartments distinct from Tf-containing endosomes. (B) A projected image volume of a cell expressing GFP-Rab10-T23N and processed for furin immunofluorescence demonstrates that the T23N mutant is relocated to the TGN. (C and D) Polarized MDCK cells expressing GFP-Rab10-Q68L were incubated for 20 min with TxR-Tf and fixed. Although some of the Q68L GFP-Rab10 associates with Tf-containing endosomes (indicated with blue arrows), a large fraction relocates to an apical compartment lacking Tf (indicated with yellow circles in the XY projection in C and yellow arrows in the XZ projection in D). Volume renderings of the cells shown in C, along with those of Figure 1C, showing cells expressing wild-type GFP-Rab10, are shown in Video 2. (E) Comparison with immunolocalized furin (red) shows that the Q68L mutant form of GFP-Rab10 does not associate with the TGN. Scale bar, 10 μm.
Figure 7.
Figure 7.
The Q68L mutant form of GFP-Rab10 is redistributed to the ARE of polarized MDCK cells. (A and B) Cells expressing GFP-Rab10 were incubated with TxR-Tf and Cy5-IgA in the basolateral medium for 20 min and fixed. In both XY projections (A) and XZ projections (B), the Q68L mutant is seen to strongly associate with the ARE, identified as containing internalized IgA, but not Tf. The 2× magnification inset shows the close correspondence between the patterns of GFP-Rab10-Q68L and internalized IgA in the ARE region of one cell. Volume renderings of the cells shown in A, along with those of Figure 4A, showing cells expressing wild-type GFP-Rab10, are shown in Video 3. (C) Image projection of cells coexpressing YFP-Rab10 and CFP-Rab11a. (D) Image projection of cells coexpressing YFP-Rab10-Q68L and CFP-Rab11a. The image volumes of C and D are reproduced as rotating volume renderings in Video 4. Scale bars, 10 μm. (E) The Q68L mutation relocates GFP-Rab10 from common endosomes to the ARE. Left, image cross-correlation analyses comparing the distribution of Cy5-IgA with either GFP-Rab10 or GFP-Rab10-Q68L in the ARE region from projected 3D image volumes collected of transfected cells labeled for 20 min with Cy5-IgA. Middle, the distribution of Cy5-IgA is much more highly correlated with GFP-Rab10-Q68L (r = 0.79, n = 30) than with GFP-Rab10 (r = 0.45, n = 22). The opposite relationship is found for internalized TxR-Tf, which is more highly associated with GFP-Rab10 (r = 0.61, n = 22) than with GFP-Rab10-Q68L (r = 0.14, n = 30). Right, correlation analysis of immunolocalized Rab11a with either GFP-Rab10 or GFP-Rab10-Q68L shows that, as with the comparison with IgA, the Q68L mutation increases the correlation between Rab11a and GFP-Rab10 from 0.32 (n = 20) to 0.78 (n = 20). Differences in all three comparisons were statistically significant, with p ≪ 0.0001. Data are presented as means ± SEM.
Figure 8.
Figure 8.
Cross-correlation analysis of sorting of internalized IgA from Tf. Cells were incubated for 20 min with basolateral TxR-Tf and Cy5-IgA and fixed. Three-dimensional image volumes were collected, and correlation analysis was performed comparing the distribution of Cy5-IgA and TxR-Tf from projected 3D image volumes of each cell. Analyses were conducted for untransfected cells (n = 30), cells expressing GFP-Rab10 (n = 20), cells expressing GFP-Rab10-Q68L (n = 30), and cells expressing GFP-Rab10-T23N (n = 16). In each case, only minor effects were observed, although the effects of expression of GFP-Rab10 and GFP-Rab10-T23N were both statistically significant (p = 0.0001 and p < 0.005, respectively). These effects were dwarfed when compared with those seen in cells treated with 10 μM brefeldin A for 10 min before and during the incubations. This treatment induces misdirection of internalized Tf to the ARE, resulting in more than a threefold increase in the correlation between Tf and IgA (increasing r from 0.23 to 0.78). Data are presented as means ± SEM.
Figure 9.
Figure 9.
Expression of wild-type and mutant GFP-Rab10 has no effects on basolateral polarity of TfR or on apical polarity of GP135. (A–D) Cells expressing the various forms of GFP-Rab10 (green) were incubated for 25 min with Cy5-Tf (blue) on the apical side and TxR-Tf (red) on the basal side of cell monolayers and fixed. Cells in A were treated with 10 μM brefeldin A for 10 min before and during the incubation. Although brefeldin A treatment results in mistargeting of TfR to the apical membrane, as reflected by significant internalization of Tf from the apical membrane (A), no such effects were seen in cells expressing GFP-Rab10 (B), GFP-Rab10-Q68L (C), or GFP-Rab10-T23N (D). (E) Cells expressing the various forms of GFP-Rab10 (green) were incubated for 20 min with Cy5-Tf (blue), fixed, and processed for GP135 immunofluorescence (red). The apical polarity of GP135 was unaffected by treatment of cells with brefeldin A or by expression of GFP-Rab10, GFP-Rab10-Q68L, or GFP-Rab10-T23N. Scale bars, 10 μm.
Figure 10.
Figure 10.
Effects of expression of wild-type and mutant GFP-Rab10 on endocytic traffic in polarized MDCK cells. (A) Effects on recycling of TfR internalized to steady state. Cells expressing different forms of GFP-Rab10 were incubated with basolateral TxR-Tf and Cy5-Tf for 25 min and then in Cy5-Tf alone for an additional 10 min and fixed. The total amount of TxR and Cy5 fluorescence associated with each cell was calculated from the summed image planes and the rate of Tf recycling calculated as described in Materials and Methods. Similar rates of recycling were observed in all conditions: 0.61 for untransfected cells (n = 24) and cells expressing GFP-Rab10 (n = 16, p = 0.95), 0.60 for cells expressing GFP-Rab10-Q68L (n = 22, p = 0.85), and 0.62 for cells expressing GFP-Rab10-T23N (n = 15, p = 0.72). None of these differences are statistically significant. Data shown are representative of two separate experiments. (B) Effects on basolateral uptake of Tf. Uptake was quantified by incubating cells for 30 min with Cy3-Tf and then with both Cy3-Tf and Cy5-Tf for an additional 4 min. As described in Materials and Methods, the rate of Tf uptake was quantified as the fraction of total steady state cell-associated fluorescence resulting from the Cy5-Tf internalized during the pulse period. For untransfected cells, Cy5-Tf internalized for 4 min accounted for 34% of the internalized Tf fluorescence (n = 66). No statistically significant effects were induced by expression of either the Q68L (34%, n = 21, p = 0.63) or T23N mutant (30%, n = 13, p = 0.10), and a small, but statistically significant decrease in uptake was found in cells expressing GFP-Rab10 (30%, n = 28, p = 0.0006). (C) Effects on recycling of TfR from early compartments. Cells were incubated with TxR-Tf for 20 min at 37°C, rinsed in ice-cold medium 1 for 10 min, incubated with Cy5-Tf for 2 min at 37°C, rinsed in ice-cold medium 1 for 10 min, incubated with TxR-Tf for 4 min at 37°C, and then fixed. Recycling was quantified from the ratio of Cy5-to-TxR fluorescence in individual cells. Recycling rates are standardized relative to that observed at 22°, a condition under which recycling is slowed. No statistically significant differences were found between untransfected cells (n = 63) and cells expressing GFP-Rab10 (p = 0.334, n = 29), but Cy5/TxR ratios were significantly lower in cells expressing either T23N (p < 0.0001, n = 19) or Q68L (p < 0.0001, n = 20). Data shown are representative of three different experiments. (D) Effects on cellular efflux of basolaterally internalized IgA. Cells were incubated with Cy5-IgA in the basolateral medium for 20 min, washed, and then incubated in the absence of IgA for an additional 20 min, with 100 μg/ml trypsin included in the apical and basolateral media. Image volumes of the same cells were collected at the beginning and end of the chase interval, and recycling was assayed by the fractional decrease in fluorescence. No statistically significant differences were found between untransfected cells (n = 63) and cells expressing GFP-Rab10 (p = 0.76, n = 31), but efflux rates were significantly higher in cells expressing either T23N (p < 0.0001, n = 19) or Q68L (p < 0.0002, n = 22). Data shown are representative of two different experiments. (E) Effects on recycling of apically internalized IgA. Cells were incubated with fluorescent IgA in the apical medium for 30 min, washed, and incubated in medium lacking IgA for an additional 12 min, with 100 μg/ml trypsin included in the apical and basolateral media. Image volumes of the same cells were collected at the beginning and end of the chase interval, and recycling was assayed by the fractional decrease in fluorescence. No statistically significant differences were found between untransfected cells (n = 109) and cells expressing GFP-Rab10 (p = 0.31, n = 33), T23N (p = 0.96, n = 28), or Q68L (p = 0.51, n = 48). Data shown are pooled from three replicate experiments. Data are presented as means ± SEM.
Figure 11.
Figure 11.
Rab10 associates with highly dynamic transport vesicles that carry Tf between endosomes. (A) Polarized MDCK cells grown on solid permeable supports were transfected with GFP-Rab10 and imaged alive by confocal microscopy. A time series of 3D image volumes were collected at a rate of 0.85 volumes per second, each volume consisting of 26 images spaced 0.6 μm apart. A projection of the first volume is shown in this figure. Video 5a shows the entire time series of projected image volumes, and Video 5b shows the time series displayed as stereo anaglyphs. The movies play at 15 times their actual rate. (B) MDCK cells grown on solid substrates were transfected with GFP-tubulin and GFP-Rab10 and imaged alive in the presence of extracellular TxR-Tf by confocal microscopy. Images were alternately collected of GFP and TxR fluorescence at a rate of 4 pairs per second over a period of 60 s. The image shows the distribution of TxR (red) and GFP (green) for a single time point, with the blue channel showing the average fluorescence of GFP over the entire time series, which has the effect of emphasizing the relatively static microtubules. Fifty seconds of the time series is shown in Video 6, which plays at seven times actual rate. The presence of TxR-Tf in the GFP-Rab10–associated vesicles is demonstrated at the end of the movie, when one portion of the movie is replayed and contrast enhanced to alternately show GFP or TxR in one region of the field. (C) MDCK cells grown on solid substrates were transfected with GFP-tubulin and GFP-Rab10 and imaged alive for 50 s at a rate of five frames per second. The panel shows the summary of a 6-s period, in which the endosomes positions at 15, 16, 19, and 21 s are coded sequentially in purple, red, yellow, and green, respectively. Microtubule labeling is accentuated by showing the mean fluorescence of a 34-frame interval in white. Twenty-nine seconds of this time series is shown in Video 7, which plays at 3.5 times the actual rate. Scale bars, 5 μm in A and 2 μm in B and C.
Figure 12.
Figure 12.
Model of the role of Rab10 in membrane transport in polarized MDCK cells. Endocytic ligands are internalized from both apical and basolateral plasma membrane domains into distinct populations of apical and basolateral early endosomes. Contents from these two pathways are rapidly mixed in a set of common endosomes, which then sort proteins to either the basolateral plasma membrane or to the ARE, from which they are then effluxed to the apical plasma membrane. Rab5 has been shown to regulate endocytic uptake (Gorvel et al., 1991; Bucci et al., 1992) and has been associated with both apical and basolateral early endosomes (Bucci et al., 1994). Proteins mediating transport from apical early endosomes have not yet been described, but the results presented here suggest that Rab10 mediates transport from basolateral sorting endosomes to common endosomes. Transport from the TGN to the basolateral membrane via common endosomes is mediated by Rab8 (Ang et al., 2003). Transport of apically directed contents via the apical recycling endosomes is mediated by Rab11a (Wang et al., 2000a). Although the protein regulators of the direct basolateral recycling pathway have not been identified, Rab4 has been associated with the early compartment that mediates this pathway (Sheff et al., 1999). This diagram is a greatly simplified version of what is known about the molecular regulation of membrane traffic in polarized MDCK cells.

Similar articles

Cited by

References

    1. Ali B., Seabra M. Targeting of Rab GTPases to cellular membranes. Biochem. Soc. Trans. 2005;33:652–656. - PubMed
    1. Ang A., Folsch H., Koivisto U.-M., Pypaert M., Mellman I. The Rab8 GTPase selectively regulates AP-1b-dependent basolateral transport in polarized Madin-Darby canine kidney cells. J. Cell Biol. 2003;163:339–350. - PMC - PubMed
    1. Apodaca G., Katz L., Mostov K. Receptor-mediated transcytosis of IgA in MDCK cells is via apical recycling endosomes. J. Cell Biol. 1994;125:67–86. - PMC - PubMed
    1. Baravelle G., Schober D., Huber M., Bayer N., Murphy R., Fuchs R. Transferrin recycling and dextran transport to lysosomes is differentially affected by bafilomycin, nocodazole and low temperature. Cell Tissue Res. 2005;320:99–113. - PubMed
    1. Barbacid M. Ras genes. Annu. Rev. Biochem. 1987;56:779–827. - PubMed

Publication types

MeSH terms