. 2005 Mar;24(3):199-207.
doi: 10.1016/j.trac.2005.01.003.

Potentiometric sensors for trace-level analysis

Affiliations

Potentiometric sensors for trace-level analysis

Eric Bakker et al. Trends Analyt Chem. 2005 Mar.

Abstract

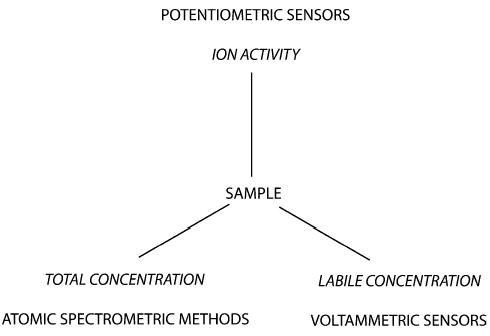
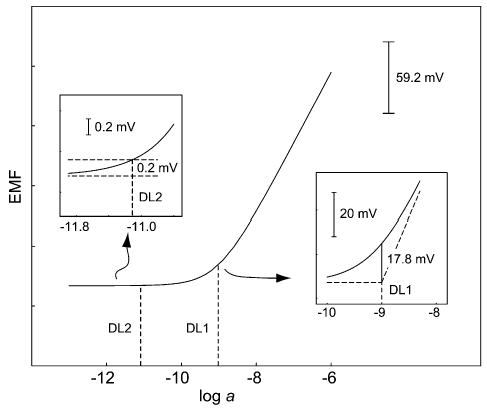
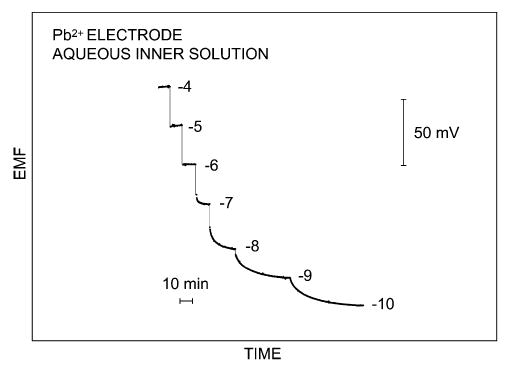
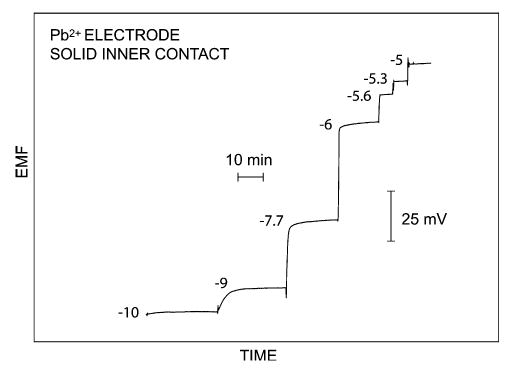
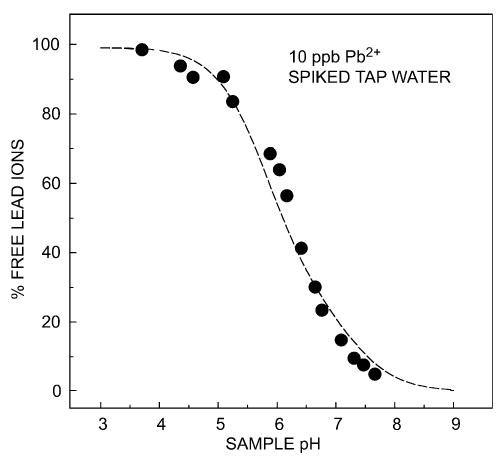
This review summarizes recent progress in the development and application of potentiometric sensors with limits of detection (LODs) in the range 10(-8)-10(-11) M. These LODs relate to total sample concentrations and are defined according to a definition unique to potentiometric sensors. LODs calculated according to traditional protocols (three times the standard deviation of the noise) yield values that are two orders of magnitude lower. We are targeting this article at analytical chemists who are non-specialists in the development of such sensors so that this technology may be adopted by a growing number of research groups to solve real-world analytical problems.We discuss the unique response features of potentiometric sensors and compare them to other analytical techniques, emphasizing that the choice of the method must depend on the problem of interest. We discuss recent directions in sensor design and development and present a list of 23 sensors with low LODs, with references. We give recent examples where potentiometric sensors have been used to solve trace-level analytical problems, including the speciation of lead and copper ions in drinking water, the measurement of free copper in sea water, and the uptake of cadmium ions by plant roots as a function of their speciation.


Figures

Figure 1
Figure 1
Schematic representation of the three principal classes of instrumental methods for trace-level analysis. The analytical information obtained from a given sample may be drastically different, especially if the analyte is complexed, chemically inert, or chemically adsorbed on particulate matter. Depending on the analytical information desired, the use of any of the three methods is attractive. Note that the analytical information obtained from each method may be varied to some extent by using sample pretreatment or analytical separation before the actual measuring step.
Figure 2
Figure 2
The traditional definition of the lower LOD of potentiometric sensors is defined as the cross-section of both extrapolated linear portions of the calibration curve (DL1) [8]. It is about two orders of magnitude higher than the LOD (DL2) calculated according to the procedure for all other analytical methods (i.e. three times the standard deviation of the background noise). Direct comparisons of different methods are valid only if the same definition of the lower LOD is used.
Figure 3
Figure 3
Experimental time traces, obtained by serial dilution of the sample, for a Pb2+-selective electrode based on a polymeric membrane containing an aqueous inner solution, in a rotating electrode set-up [26]. The numbers shown are logarithmic molar concentrations of the sample, and the LOD (DL1, see Fig. 2) was found as 6 × 10⁻¹¹ M. The membrane was placed off-center of the rotating axis for maximum reduction of the aqueous Nernst diffusion layer thickness.
Figure 4
Figure 4
Experimental time traces, obtained by standard addition, for a Pb2+-selective electrode based on a plasticizer-free polymeric membrane with poly(octylthiophene) placed on gold as a solid inner contact at the rear of the membrane [28]. The numbers shown are logarithmic molar sample concentrations. The observed LOD was 5 × 10⁻¹⁰ M.
Figure 5
Figure 5
Speciation analysis of drinking water spiked with 10 ppb Pb2+ as a function of the sample pH, performed with a potentiometric sensor [24]. The dotted line represents the calculated behavior based on the stability of the lead-carbonate complexes in the sample. As shown in Fig. 1, such sensors are responsive to the activity (free concentration) of the analyte.

Similar articles

Cited by

References

    1. Buck RP, Lindner E. Anal. Chem. 2001;73:88A. - PubMed
    1. Bakker E, Bühlmann P, Pretsch E. Chem. Rev. 1997;97:3083. - PubMed
    1. Bühlmann P, Pretsch E, Bakker E. Chem. Rev. 1998;98:1593. - PubMed
    1. Bakker E, Pretsch E, Bühlmann P. Anal. Chem. 2000;72:1127. - PubMed
    1. Bakker E, Pretsch E. Trends Anal. Chem. 2001;20:11.

LinkOut - more resources