

doi: 10.1086/503751.
Epub 2006 Mar 17.
Coverage and power in genomewide association studies
Affiliations
- PMID: 16642443
- PMCID: PMC1474045
- DOI: 10.1086/503751
Item in Clipboard
Coverage and power in genomewide association studies
Am J Hum Genet.
2006 May.
Abstract
The ability of genomewide association studies to decipher genetic traits is driven in part by how well the measured single-nucleotide polymorphisms "cover" the unmeasured causal variants. Estimates of coverage based on standard linkage-disequilibrium measures, such as the average maximum squared correlation coefficient (r2), can lead to inaccurate and inflated estimates of the power of genomewide association studies. In contrast, use of the "cumulative r2 adjusted power" measure presented here gives more-accurate estimates of power for genomewide association studies.
Figures
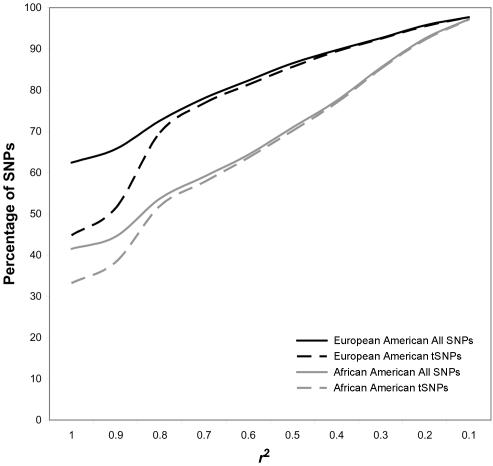
Cumulative distribution of maximum r2 values from the study by Hinds et al.
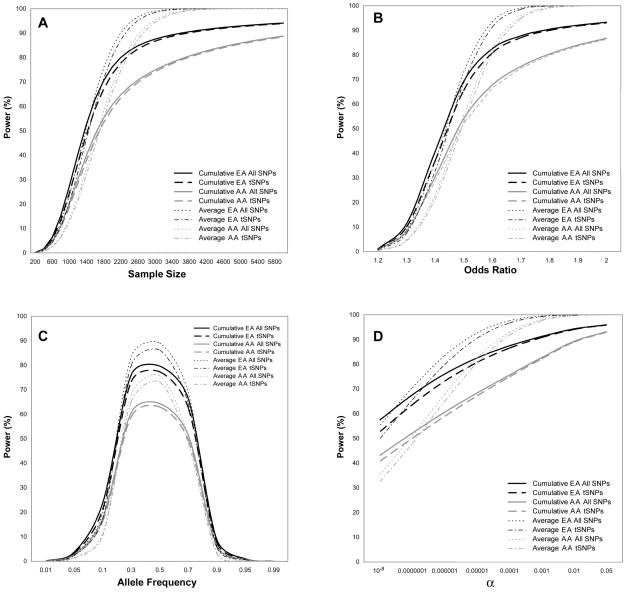
Effects of varying parameter values on average and cumulative r2 adjusted power. Plots are based on a case-control study with 1,000 cases and 1,000 unmatched controls, disease-allele frequency 0.3, OR 1.5, α level 10−6, and a log additive (multiplicative) model. For each plot, power was calculated by varying one parameter while holding the other parameters constant. AA = African American; EA = European American. A, Sample size is varied from 100 cases and 100 controls to 3,000 cases and 3,000 controls. B, OR is varied from 1.2 to 2.0. C, Disease-allele frequency is varied from 0.01 to 0.99. D, The α level is varied from 10−8 to 0.05.
References
Web Resources
-
- Quanto software, http://hydra.usc.edu/GxE/
References
-
- Risch N, Teng J (1998) The relative power of family-based and case-control designs for linkage disequilibrium studies of complex human diseases I. DNA pooling. Genome Res 8:1273–1288 - PubMed
Publication types
MeSH terms
Grants and funding
LinkOut - more resources
Full Text Sources
Other Literature Sources
