. 2006 Apr;119(4):2363-71.
doi: 10.1121/1.2173513.

Vocal responses to unanticipated perturbations in voice loudness feedback: an automatic mechanism for stabilizing voice amplitude

Affiliations

Vocal responses to unanticipated perturbations in voice loudness feedback: an automatic mechanism for stabilizing voice amplitude

Jay J Bauer et al. J Acoust Soc Am. 2006 Apr.

Abstract

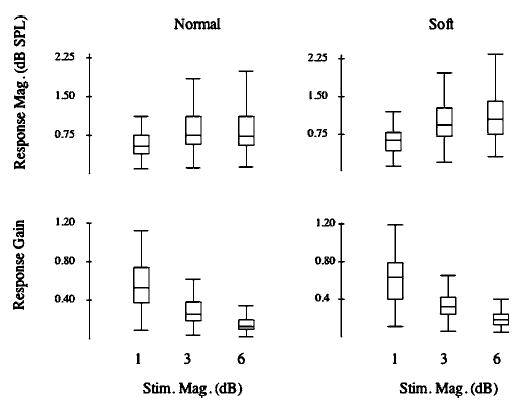
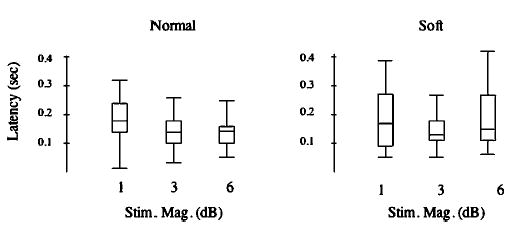
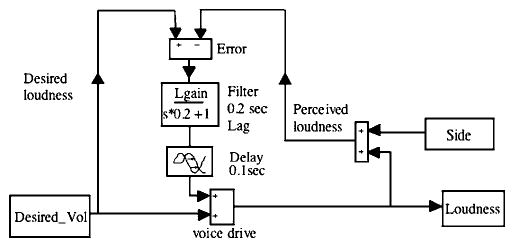
The present study tested whether subjects respond to unanticipated short perturbations in voice loudness feedback with compensatory responses in voice amplitude. The role of stimulus magnitude (+/- 1,3 vs 6 dB SPL), stimulus direction (up vs down), and the ongoing voice amplitude level (normal vs soft) were compared across compensations. Subjects responded to perturbations in voice loudness feedback with a compensatory change in voice amplitude 76% of the time. Mean latency of amplitude compensation was 157 ms. Mean response magnitudes were smallest for 1-dB stimulus perturbations (0.75 dB) and greatest for 6-dB conditions (0.98 dB). However, expressed as gain, responses for 1-dB perturbations were largest and almost approached 1.0. Response magnitudes were larger for the soft voice amplitude condition compared to the normal voice amplitude condition. A mathematical model of the audio-vocal system captured the main features of the compensations. Previous research has demonstrated that subjects can respond to an unanticipated perturbation in voice pitch feedback with an automatic compensatory response in voice fundamental frequency. Data from the present study suggest that voice loudness feedback can be used in a similar manner to monitor and stabilize voice amplitude around a desired loudness level.


Figures

FIG. 1
FIG. 1
(A) illustrates the voice rms pressure wave in dB across an entire recording session of ten vocalizations for one subject in one condition. (B) illustrates individual trials for upward loudness shifts for portions of the data in (A). The generally horizontal lines indicate there was little tendency for the subject to gradually reduce vocal loudness during the trials.
FIG. 2
FIG. 2
Averaged responses for a representative subject for the 6-dB stimulus magnitude condition, upward and downward stimuli, and voice amplitude conditions. Description of panels: top row shows responses in the normal (N) voice condition, and bottom row shows responses in the soft (S) voice condition. Left column shows responses for downward stimuli, and right column shows responses for upward stimuli. Stimulus timing and direction are illustrated by square trace at bottom of panels. Solid curved line is averaged response. Dashed curved line is simulated response. Horizontal dotted lines indicates ±2 SDs of prestimulus mean. Vertical dashed lines indicate response latency.
FIG. 3
FIG. 3
Averaged responses and simulations for the same subject as in Fig. 1 for the 3-dB stimulus condition.
FIG. 4
FIG. 4
Averaged responses and simulation for the same subject as in Figs. 1 and 2 for the 1-dB stimulus condition. Dotted lines representing the pre-stimulus mean loudness are not shown in the upper traces because these data did not meet the criteria of acceptable responses.
FIG. 5
FIG. 5
Box plots illustrating response magnitude (dB SPL) (top row) and gain (bottom row) as a function of stimulus magnitude. Normal voice condition is on the left and soft voice condition is on the right. Box definitions: middle line is median, top and bottom of boxes are 75th and 25th percentiles, whiskers extend to limits of main body of data defined as high hinge +1.5 (high hinge—low hinge), and low hinge −1.5 (high hinge—low hinge). Points depicted by a circle extend beyond these limits, unless they exceed high hinge +3.0 (high hinge—low hinge) or low hinge −3.0 (high hinge—low hinge), in which case they are shown by an asterisk (DATA DESK; DATA DESCRIPTION).
FIG. 6
FIG. 6
Box plots illustrating response latencies (seconds) as a function of stimulus magnitude (dB). Data for normal voice condition are on the left and soft condition on the right.
FIG. 7
FIG. 7
Model of audio-vocal system producing the simulated traces depicted in Figs. 2–4. The variable representing desired loudness, Desired_Vol, is converted through a “black box” representing the entire central vocal production system (here just a summing junction labeled voice drive) into loudness. Loudness can be perturbed by adding a side input, creating perceived loudness. Error is computed by the difference between desired loudness and perceived loudness. Error is low-pass filtered in the element filter by scaling by Lgain and applying a lag with a time constant of 0.2 s. The filtered error signal is then passed through a delay of 0.1 s (to reproduce observed response latency), and added into the voice drive signal.

References

    1. Adams SG, Lang AE. “Can the Lombard effect be used to improve low voice intensity in Parkinson’s disease? Eur J Disord Commun. 1992;27(2):121–127. - PubMed
    1. Alpert M, Rosenberg SD, Pouget ER, Shaw RJ. “Prosody and lexical accuracy in flat affect schizophrenia,”. Psychiatry Res. 2000;97(2–3):107–118. - PubMed
    1. Bauer JJ. Ph.D. dissertation, Northwestern University. 2004. “Task dependent modulation of voice F0 responses elicited by perturbations in pitch of auditory feedback during English speech and sustained vowels,”.
    1. Bauer JJ, Larson CR. Audio-vocal responses to repetitive pitch-shift stimulation during a sustained vocalization: Improvements in methodology for the pitch-shifting technique. J Acoust Soc Am. 2003;114(2):1048–1054. - PMC - PubMed
    1. Burnett TA, Larson CR. Early pitch shift response is active in both steady and dynamic voice pitch control. J Acoust Soc Am. 2002;112(3):1058–1063. - PubMed

Publication types