

MIDAS: software for analysis and visualisation of interallelic disequilibrium between multiallelic markers
- PMID: 16643648
- PMCID: PMC1479374
- DOI: 10.1186/1471-2105-7-227
MIDAS: software for analysis and visualisation of interallelic disequilibrium between multiallelic markers
Abstract
Background: Various software tools are available for the display of pairwise linkage disequilibrium across multiple single nucleotide polymorphisms. The HapMap project also presents these graphics within their website. However, these approaches are limited in their use of data from multiallelic markers and provide limited information in a graphical form.
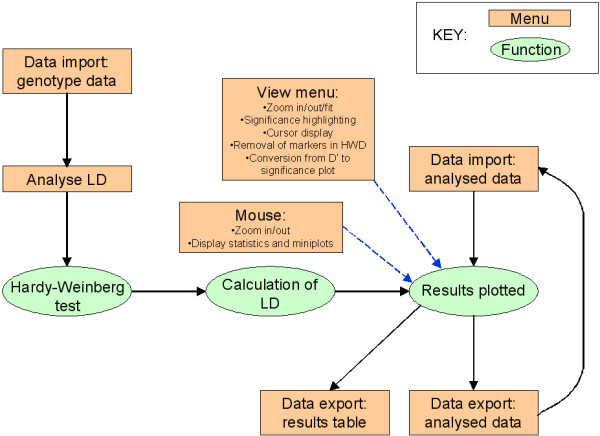
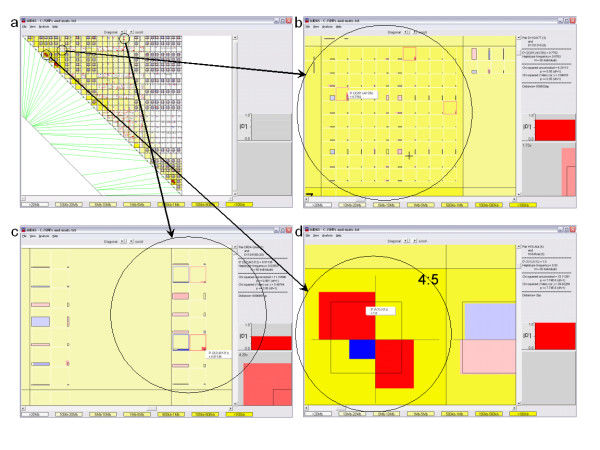
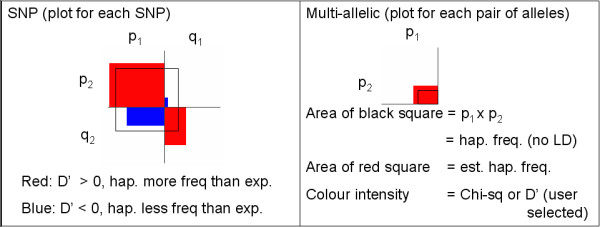
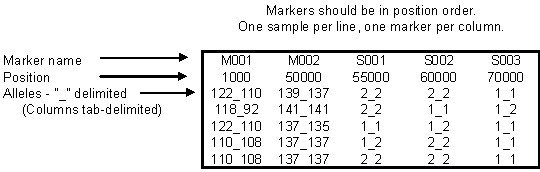
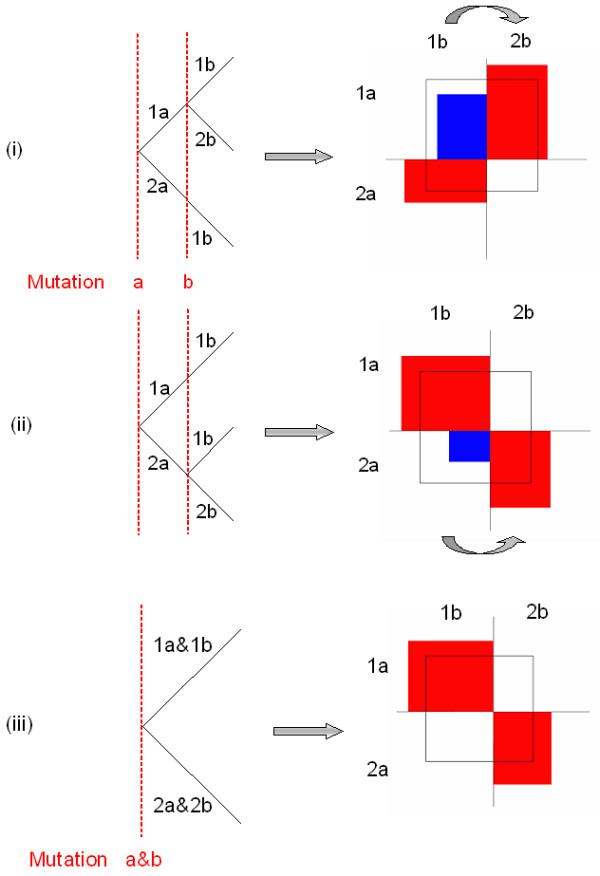
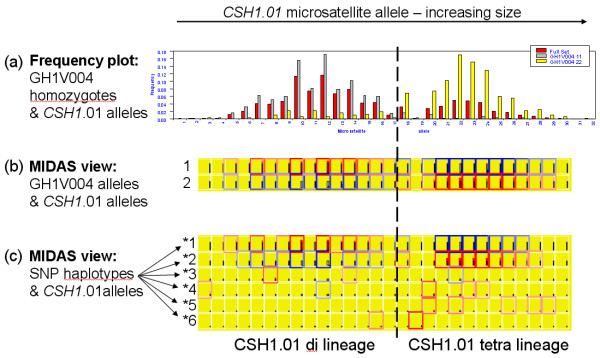
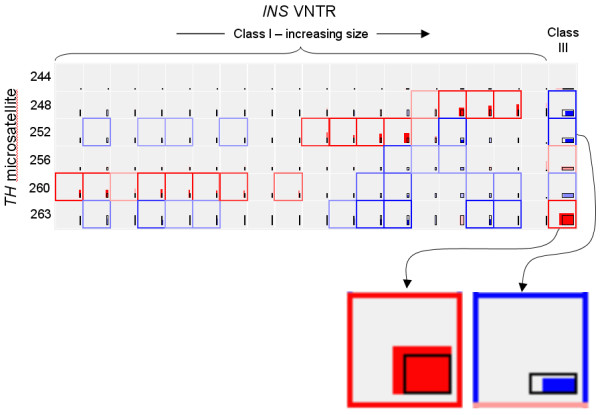
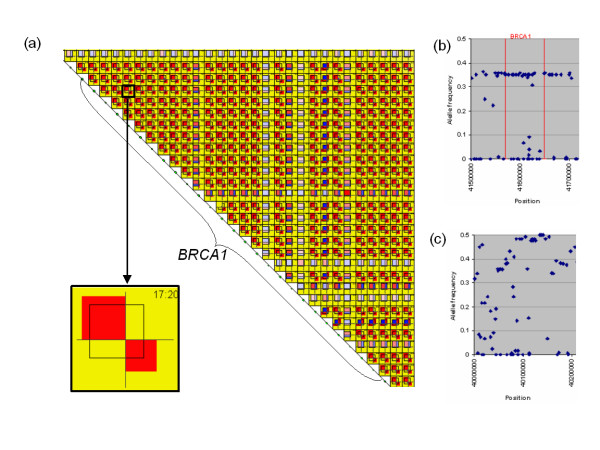
Results: We have developed a software package (MIDAS - Multiallelic Interallelic Disequilibrium Analysis Software) for the estimation and graphical display of interallelic linkage disequilibrium. Linkage disequilibrium is analysed for each allelic combination (of one allele from each of two loci), between all pairwise combinations of any type of multiallelic loci in a contig (or any set) of many loci (including single nucleotide polymorphisms, microsatellites, minisatellites and haplotypes). Data are presented graphically in a novel and informative way, and can also be exported in tabular form for other analyses. This approach facilitates visualisation of patterns of linkage disequilibrium across genomic regions, analysis of the relationships between different alleles of multiallelic markers and inferences about patterns of evolution and selection.
Conclusion: MIDAS is a linkage disequilibrium analysis program with a comprehensive graphical user interface providing novel views of patterns of linkage disequilibrium between all types of multiallelic and biallelic markers.
Figures
Similar articles
-
JLIN: a java based linkage disequilibrium plotter.BMC Bioinformatics. 2006 Feb 9;7:60. doi: 10.1186/1471-2105-7-60. BMC Bioinformatics. 2006. PMID: 16466584 Free PMC article.
-
snp.plotter: an R-based SNP/haplotype association and linkage disequilibrium plotting package.Bioinformatics. 2007 Mar 15;23(6):774-6. doi: 10.1093/bioinformatics/btl657. Epub 2007 Jan 18. Bioinformatics. 2007. PMID: 17234637
-
SNPLINK: multipoint linkage analysis of densely distributed SNP data incorporating automated linkage disequilibrium removal.Bioinformatics. 2005 Jul 1;21(13):3060-1. doi: 10.1093/bioinformatics/bti449. Epub 2005 Apr 19. Bioinformatics. 2005. PMID: 15840706
-
Linkage disequilibrium for different scales and applications.Brief Bioinform. 2004 Dec;5(4):355-64. doi: 10.1093/bib/5.4.355. Brief Bioinform. 2004. PMID: 15606972 Review.
-
On selecting markers for association studies: patterns of linkage disequilibrium between two and three diallelic loci.Genet Epidemiol. 2003 Jan;24(1):57-67. doi: 10.1002/gepi.10217. Genet Epidemiol. 2003. PMID: 12508256 Review.
Cited by
-
The Relation between eNOS -786 C/T, 4 a/b, MMP-13 rs640198 G/T, Eotaxin 426 C/T, -384 A/G, and 67 G/A Polymorphisms and Long-Term Outcome in Patients with Coronary Artery Disease.Dis Markers. 2015;2015:232048. doi: 10.1155/2015/232048. Epub 2015 Sep 30. Dis Markers. 2015. PMID: 26491210 Free PMC article.
-
Single nucleotide polymorphisms and microsatellites in the canine glutathione S-transferase pi 1 (GSTP1) gene promoter.Canine Genet Epidemiol. 2017 Oct 11;4:9. doi: 10.1186/s40575-017-0050-8. eCollection 2017. Canine Genet Epidemiol. 2017. PMID: 29046813 Free PMC article.
-
Interferon lambda polymorphisms associate with body iron indices and hepatic expression of interferon-responsive long non-coding RNA in chronic hepatitis C.Clin Exp Med. 2017 May;17(2):225-232. doi: 10.1007/s10238-016-0423-4. Epub 2016 Apr 28. Clin Exp Med. 2017. PMID: 27125837 Free PMC article.
-
Polymorphic SVA retrotransposons at four loci and their association with classical HLA class I alleles in Japanese, Caucasians and African Americans.Immunogenetics. 2010 Apr;62(4):211-30. doi: 10.1007/s00251-010-0427-2. Epub 2010 Feb 20. Immunogenetics. 2010. PMID: 20174920
-
Emerging paradigms in genomics-based crop improvement.ScientificWorldJournal. 2013 Nov 17;2013:585467. doi: 10.1155/2013/585467. ScientificWorldJournal. 2013. PMID: 24348171 Free PMC article. Review.
References
Publication types
MeSH terms
Substances
LinkOut - more resources
Full Text Sources
