. 2006 Jul 7;281(27):18351-62.
doi: 10.1074/jbc.M601277200. Epub 2006 Apr 27.

Regulation of rat hepatic L-pyruvate kinase promoter composition and activity by glucose, n-3 polyunsaturated fatty acids, and peroxisome proliferator-activated receptor-alpha agonist

Affiliations

Regulation of rat hepatic L-pyruvate kinase promoter composition and activity by glucose, n-3 polyunsaturated fatty acids, and peroxisome proliferator-activated receptor-alpha agonist

Jinghua Xu et al. J Biol Chem. .

Abstract

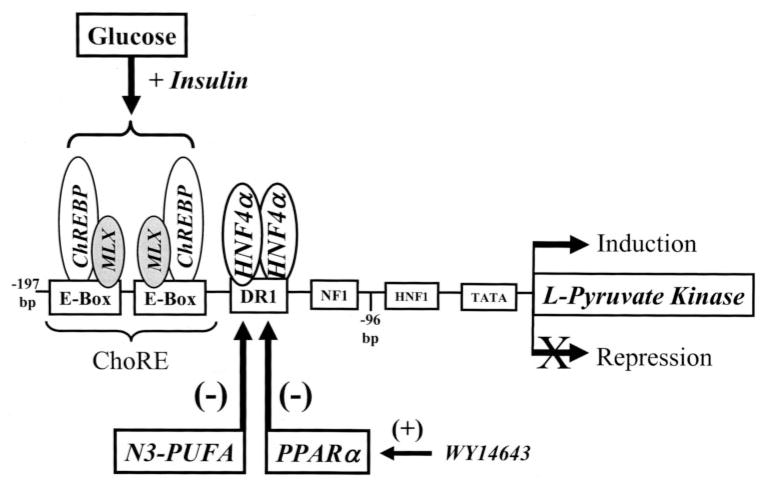
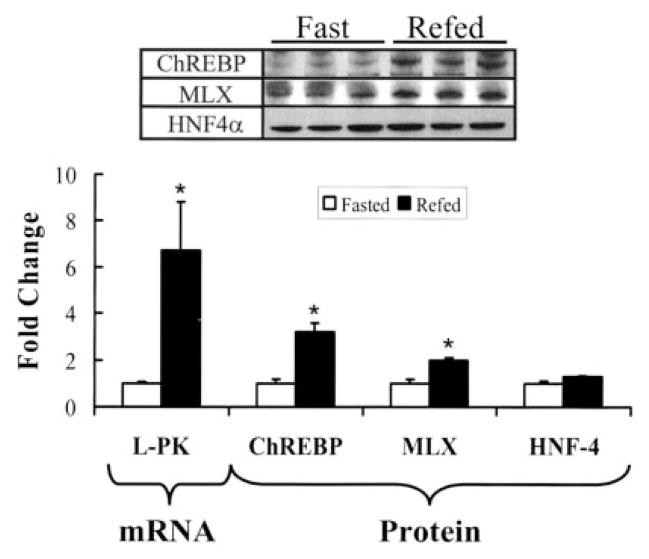
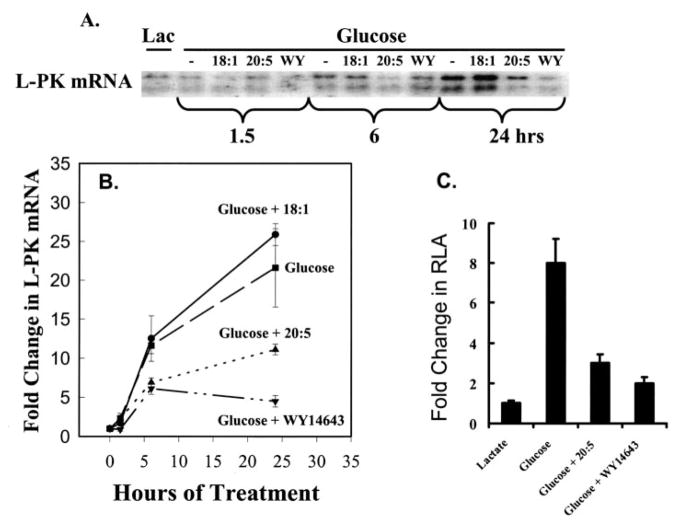
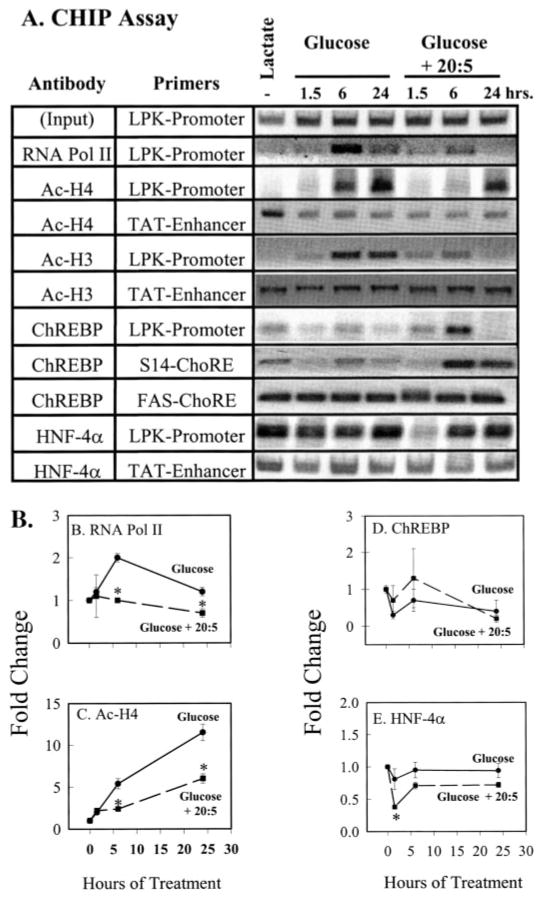
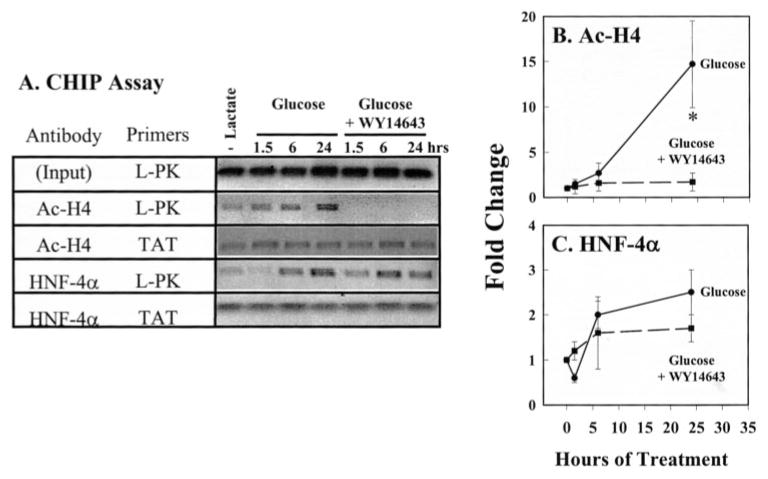
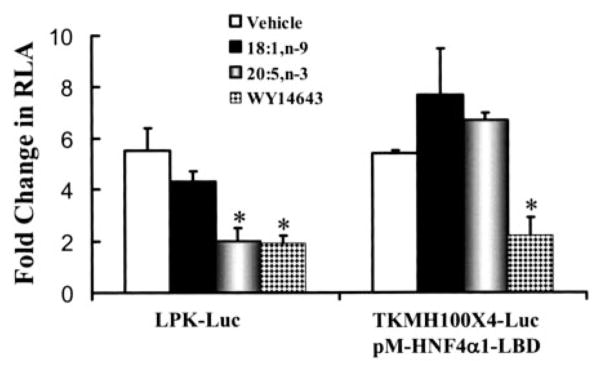
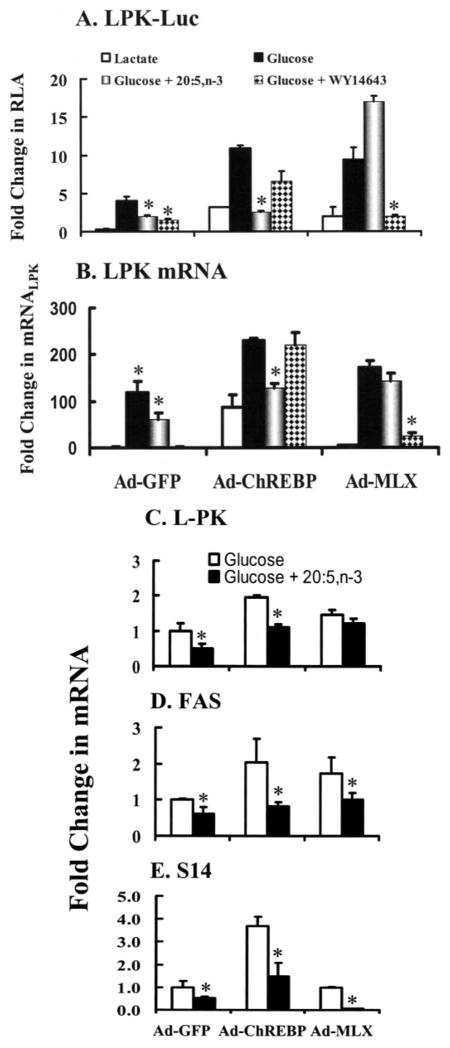
Carbohydrate regulatory element-binding protein (ChREBP), MAX-like factor X (MLX), and hepatic nuclear factor-4alpha (HNF-4alpha) are key transcription factors involved in the glucose-mediated induction of hepatic L-type pyruvate kinase (L-PK) gene transcription. n-3 polyunsaturated fatty acids (PUFA) and WY14643 (peroxisome proliferator-activated receptor alpha (PPARalpha) agonist) interfere with glucose-stimulated L-PK gene transcription in vivo and in rat primary hepatocytes. Feeding rats a diet containing n-3 PUFA or WY14643 suppressed hepatic mRNA(L-PK) but did not suppress hepatic ChREBP or HNF-4alpha nuclear abundance. Hepatic MLX nuclear abundance, however, was suppressed by n-3 PUFA but not WY14643. In rat primary hepatocytes, glucose-stimulated accumulation of mRNA(LPK) and L-PK promoter activity correlated with increased ChREBP nuclear abundance. This treatment also increased L-PK promoter occupancy by RNA polymerase II (RNA pol II), acetylated histone H3 (Ac-H3), and acetylated histone H4 (Ac-H4) but did not significantly impact L-PK promoter occupancy by ChREBP or HNF-4alpha. Inhibition of L-PK promoter activity by n-3 PUFA correlated with suppressed RNA pol II, Ac-H3, and Ac-H4 occupancy on the L-PK promoter. Although n-3 PUFA transiently suppressed ChREBP and MLX nuclear abundance, this treatment did not impact ChREBP-LPK promoter interaction. HNF4alpha-LPK promoter interaction was transiently suppressed by n-3 PUFA. Inhibition of L-PK promoter activity by WY14643 correlated with a transient decline in ChREBP nuclear abundance and decreased Ac-H4 interaction with the L-PK promoter. WY14643, however, had no impact on MLX nuclear abundance or HNF4alpha-LPK promoter interaction. Although overexpressed ChREBP or HNF-4alpha did not relieve n-3 PUFA suppression of L-PK gene expression, overexpressed MLX fully abrogated n-3 PUFA suppression of L-PK promoter activity and mRNA(L-PK) abundance. Overexpressed ChREBP, but not MLX, relieved the WY14643 inhibition of L-PK. In conclusion, n-3 PUFA and WY14643/PPARalpha target different transcription factors to control L-PK gene transcription. MLX, the heterodimer partner for ChREBP, has emerged as a novel target for n-3 PUFA regulation.


Figures

FIGURE 1
FIGURE 1. Schematic of the L-PK promoter
The diagram illustrates the location of key transcription factors and their binding sites on the L-PK promoter. Factors regulated by glucose, fatty acids, and the PPARα agonist WY14643 are identified. Linker scanning studies established that the ChoRE was required for glucose control, whereas the DR-1 element was required for PUFA and PPARα control of L-PK gene transcription (5, 6, 13).
FIGURE 2
FIGURE 2. Effect of fasting and refeeding on hepatic content of ChREBP, MLX, and HNF-4α
Rats were meal-fed a high carbohydrate diet supplemented with olive oil for 7 days (“Materials and Methods”). Olive oil-fed rats were fasted overnight (white bars) or meal-fed (black bars) the olive oil diet for 4 h. Fasted rats were euthanized at 8 a.m.; fed rats were euthanized 2 h after completion of the meal, i.e. at 2 p.m. Hepatic RNA and nuclear protein extracts were prepared for Northern and Western blotting. Upper panel, immunoblot of hepatic nuclear abundance of ChREBP, MLX, and HNF-4α from three separate rats per treatment. Lower panel, L-PK mRNA was measured by Northern analysis and quantified along with the abundance of nuclear ChREBP, MLX, and HNF-4 measured by immunoblot. Quantified results are expressed as fold change from the fasted level, mean ± S.D., n = 3. *, p < 0.005, Student’s t test.
FIGURE 3
FIGURE 3. Effect of dietary fat and WY14643 on hepatic content of ChREBP, MLX, and HNF-4α
Rats were meal fed a high carbohydrate diet supplemented with olive oil, fish oil, or olive oil + WY14643 for 7 days (“Materials and Methods”). Hepatic RNA and cytoplasmic and nuclear protein were isolated from animals euthanized 2 h after completion of the meal. A, immunoblots for nuclear HNF-4α (HNF-4), ChREBP, and MLX abundance and cytoplasmic ChREBP and MLX. Results are from three separate animals per treatment. B, quantified levels of nuclear protein abundance of ChREBP, MLX, and HNF-4α as measured by immunoblot. C, mRNA abundance of L-PK, ChREBP, MLX, and HNF-4α as measured by qRT-PCR. Results are expressed as fold change from olive oil-fed rats. Results are the mean ± S.D. for seven different animals per treatment. *, p ≤ 0.01, analysis of variance.
FIGURE 4
FIGURE 4. Regulation of L-PK mRNA in primary hepatocytes by glucose, 18:1, n-9, 20:5, n-3, and WY14643
Rat primary hepatocytes were maintained in Williams E medium +10 mM lactate (Lac) + 10 nM insulin or switched to Williams E containing 25 mM glucose + 1 μM insulin in the absence or presence of 250 μM fatty acids (18:1, n-9 or 20:5, n-3) or 100 μM WY14643. Cells were harvested at the times indicated for total RNA extraction. L-PK mRNA was detected by Northern analysis (A) and quantified (B). Quantified results are expressed as fold change in L-PK mRNA from lactate-treated cells, mean + S.D., n = 4. C, primary hepatocytes in lactate-containing medium were transfected with L-PK-Luc (firefly) and phRG-Luc (Renilla) (see “Materials and Methods”) and treated as above with glucose, fatty acids, or WY14643 for 24 h. Cells were harvested for luciferase assays. Results are expressed as the fold change in relative luciferase activity (RLA) from lactate-treated cells, mean ± S.D., n = 4.
FIGURE 5
FIGURE 5. The effect of glucose, 20:5, n-3, and WY14643 on the nuclear abundance of ChREBP and MLX in rat primary hepatocytes
Rat primary hepatocytes were maintained in lactate-containing Williams E + insulin or switched to Williams E + glucose + insulin without or with 20:5, n-3 (250 μM) or WY14643 (100 μM). Cells were harvested at the times indicated. Nuclear protein extracts were assayed for the amount of ChREBP or MLX by immunoblotting (A). The immunoblots were quantified for ChREBP(B) and MLX (C) nuclear abundance. HNF-4α remained unchanged by this treatment (not shown). Results are expressed as fold change from lactate (0-h)-treated cells; mean ± S.D., n = 3. *, p < 0.05 versus glucose treated cells, Student’s t test.
FIGURE 6
FIGURE 6. Effects of glucose and 20:5, n-3 on L-PK promoter composition
The ChIP assay was used to examine the composition of the rat L-PK, TAT, FAS, and S14 promoters. HNF-4 binds the TAT enhancer (TAT-Enhancer) −3062 to −3579 bp upstream from the transcription start site. The S14 ChoRE is located between −1.4 and −1.35 kb from the transcription start site. The fatty-acid synthase ChoRE (FAS-ChoRE) is located between −7.2 and −7.1 kb from the transcription start site (Table 1). Rat primary hepatocytes were treated as described in Fig. 5. At the times indicated, cells were treated with formaldehyde for the ChIP assay. Fragmented chromatin was immunoprecipitated (IP) with antibodies against RNA polymerase II (RNA pol II), acetylated histone H3 (Ac-H3), acetylated histone H4 (Ac-H4), ChREBP or HNF-4α. DNA was extracted from the immunoprecipitated complex, and 5 μl of 50 μl of purified DNA was used as template for PCR to amplify the L-PK promoter (−288 to +12 bp) or the TAT enhancer (−3730 to −3431 bp), the S14 ChoRE (−1485 to −1350 bp) and the FAS-ChoRE (−7221 to −7125 bp). Primers for the S14 proximal promoter (−290 to +19 bp), the β-actin coding (+2383 to +3091 bp), and the PepCk promoter (−550 to + 67 bp) were also used (Table 1). The PCRs for the S14 promoter, β-actin coding region, and PepCk promoter did not yield PCR products from chromatin immunoprecipitated with ChREBP antibody. Input, 1% of the sample used for IP was taken out prior to IP to represent total DNA quantity. A, representative PCR products from the input DNA and DNA immunoprecipitated with RNA pol II, Ac-H3, Ac-H4, ChREBP, or HNF-4α antibodies. Results of the ChIP assay were quantified (B–E); mean ± S.D. for three independent studies. Glucose-treated cells (filled circles, solid line); glucose + 20:5-treated cells (filled box, dashed line). *, p < 0.01 versus glucose-treated cells, Student’s t test.
FIGURE 7
FIGURE 7. Effects of glucose and WY14643 on L-PK promoter composition
The ChIP assay was used to examine the promoter composition of the rat L-PK and TAT promoters following glucose and WY14643 treatment. Rat primary hepatocytes were treated as described in Fig. 4 and harvested for the ChIP assay. Fragmented chromatin was immunoprecipitated (IP) with antibodies against acetylated histone H4 (Ac-H4) and HNF-4α. DNA was extracted from the immunoprecipitates; 5 μl of 50 μl of purified DNA was used in a PCR to detect the L-PK promoter (−288 to +12 bp) and TAT promoter (−3730 to −3431 bp). Input, 1% of the samples to be used in IP were taken out prior to IP to represent total DNA quantity. A, representative PCR products form the input and products immunoprecipitated with Ac-H4 or HNF-4α antibodies. B and C, PCR products were quantified; mean ± S.D. for three independent studies. Glucose-treated cells (filled circles, solid line); Glucose + WY14643-treated cells (filled box, dashed line). Means ± S.D. for three independent studies. *, p < 0.01 versus glucose-treated cells, Student’s t test.
FIGURE 8
FIGURE 8. Effect of fatty acids and WY14643 on HNF-4α transactivation in rat primary hepatocytes
Primary rat hepatocytes were transfected with L-PK-Luc reporter plasmid or co-transfected with the TKMH100×4-Luc reporter plasmid plus the pM-HNF4α1-LBD plasmid. pM-HNF-4α-LBD contains the SV40 early promoter driving expression of a fusion protein consisting of the Gal4 DNA binding domain fused to the HNF-4α1 ligand binding domain (E region). All transfections included phRG-Luc as an internal control (see “Materials and Methods”). All cells were transfected while in Williams E medium containing lactate +insulin. Cells were switched to Williams E medium + glucose + insulin in the absence and presence of 250 μM 18:1, n-9, 20:5, n-3, or 100 μM WY14643. Cells were harvested 24 h later for the luciferase assay. Results are expressed as fold induction of relative luciferase activity (RLA). L-PK-Luc activity was induced by glucose, whereas TKMH100×4-Luc activity was induced by co-transfection of pM-HNF4α-LBD. Lactate and glucose did not affect TKMH100×4-Luc activity in the presence or absence of pM-HNF4α-LBD. Means ± S.D., n = 6. Similar results were obtained using a pM-HNF-4α containing the full-length HNF-4α fused to the Gal4 DNA binding domain. *, p < 0.05 versus vehicle-treated cells, Student’s t test.
FIGURE 9
FIGURE 9. Effect of overexpressed ChREBP and MLXβ on L-PK-Luc activity, mRNAL-PK mRNAS14, and mRNAFAS
A, rat primary hepatocytes were infected with recombinant adenovirus expressing green fluorescent protein (GFP, Ad-GFP, control), ChREBP (Ad-ChREBP), or MLX (Ad-MLXβ) while in Williams E medium containing lactate and insulin. GFP is expressed from an internal ribosome entry site in the Ad-ChREBP and Ad-MLX adenovirus. Expression levels of GFP in primary hepatocytes were verified by fluorescence microscopy. Twenty four hours after infection, cells were transfected with L-PK-Luc and phRG-Luc overnight. The next day cells were maintained in Williams E containing lactate + insulin or switched to Williams E + glucose + insulin without or with 20:5, n-3 or WY14643. Cells were harvested 24 h later for luciferase activity. Results are expressed as fold change in relative luciferase activity (RLA); means ± S.D., n = 3. Results are representative of three separate studies with triplicate samples in each study. B and C, rat primary hepatocytes were infected with recombinant adenovirus as described above. Twenty four hours after infection, cells were switched from the lactate containing medium to the glucose containing medium in the absence or presence of 20:5, n-3 or WY14643. Cells were harvested 24 h later for RNA extraction and measurement of L-PK, FAS, S14, and cyclophilin mRNA abundance by qRT-PCR. The abundance of L-PK, FAS, or S14 mRNA relative to cyclophilin mRNA was calculated by the Ct method. B, results are quantified and expressed as fold change in mRNAL-PK-induced virus infection and by glucose, glucose + 20:5, or glucose + WY14643. Results are normalized to the level of mRNAL-PK in the lactate-treated cells infected with Ad-GFP. Results are the means of two separate studies. C–E, the effect of 20:5, n-3 on L-PK, FAS, and S14 mRNA in primary hepatocytes infected with Ad-GFP, Ad-ChREBP, or Ad-MLX was quantified. Cells were treated as above. Results are reported fold change in mRNA; results are normalized to the transcript level in glucose-treated-Ad-GFP-infected cells. Results are the means ± range of duplicate studies. Results are representative of two independent studies. *, p < 0.05 versus glucose-treated cells, Student’s t test.

References

    1. Granner D, Pilkis S. J Biol Chem. 1990;265:10173–10176. - PubMed
    1. Jump DB, Botolin D, Wang Y, Xu J, Christian B, Demeure O. J Nutr. 2005;135:2503–2506. - PubMed
    1. Jump DB. CRC Crit Rev Clin Lab Sci. 2004;41:41–78. - PubMed
    1. Towle HC. Trends Endocrinol Metab. 2005;16:489–494. - PubMed
    1. Liimatta M, Towle HC, Clarke S, Jump DB. Mol Endocrinol. 1994;8:1147–1153. - PubMed

Publication types

MeSH terms