Review
. 2006 Jul;98(1):9-32.
doi: 10.1093/aob/mcl076. Epub 2006 Apr 27.

Conditions leading to high CO2 (>5 kPa) in waterlogged-flooded soils and possible effects on root growth and metabolism

Affiliations
Review

Conditions leading to high CO2 (>5 kPa) in waterlogged-flooded soils and possible effects on root growth and metabolism

Hank Greenway et al. Ann Bot. 2006 Jul.

Abstract

Aims: Soil waterlogging impedes gas exchange with the atmosphere, resulting in low P(O2) and often high P(CO2). Conditions conducive to development of high P(CO2) (5-70 kPa) during soil waterlogging and flooding are discussed. The scant information on responses of roots to high P(CO2) in terms of growth and metabolism is reviewed.

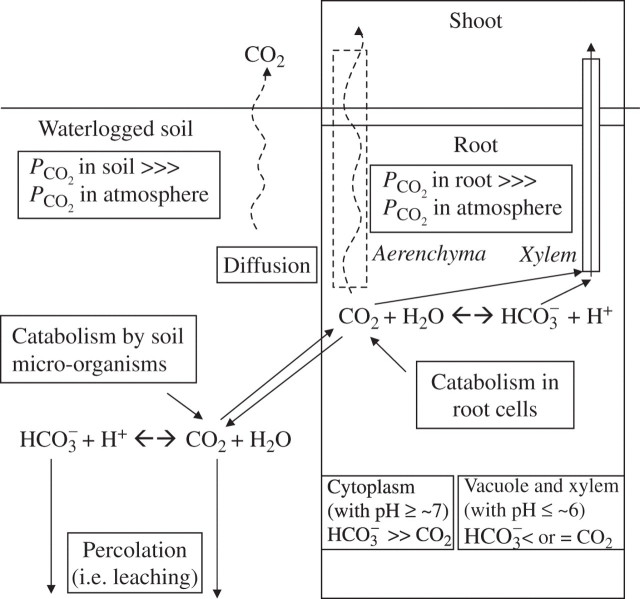
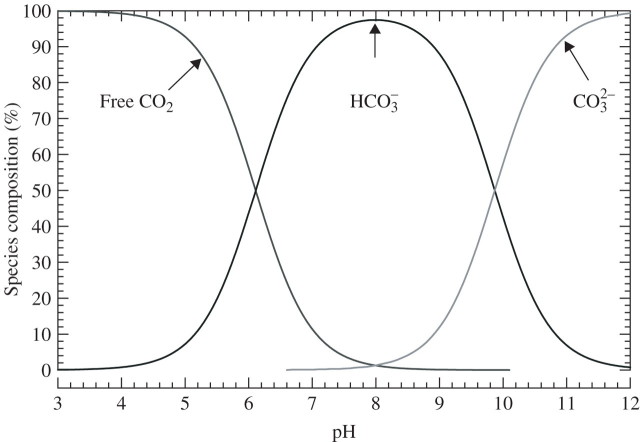
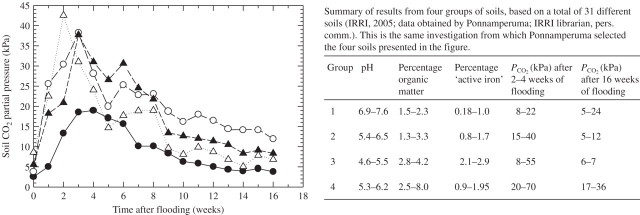
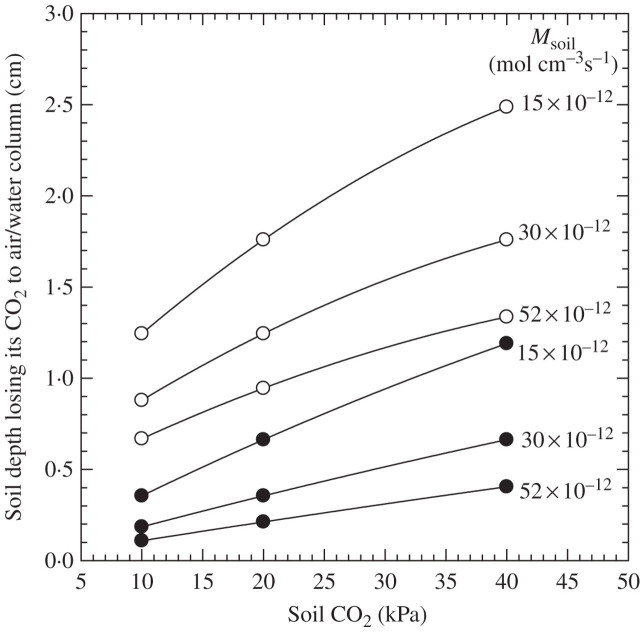
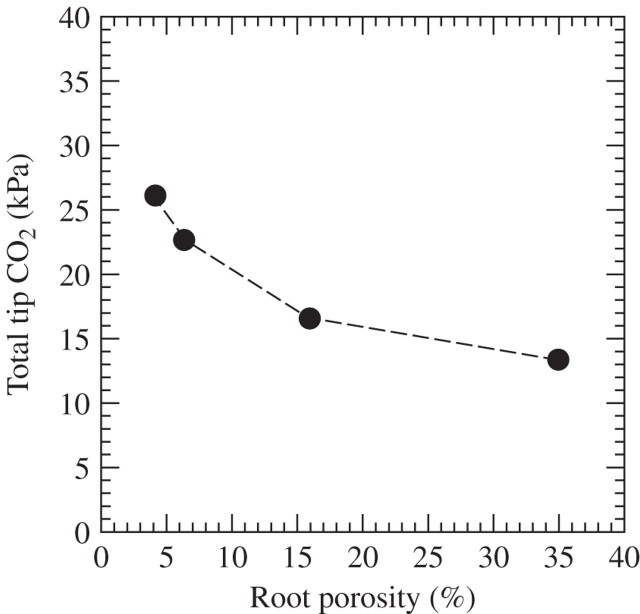
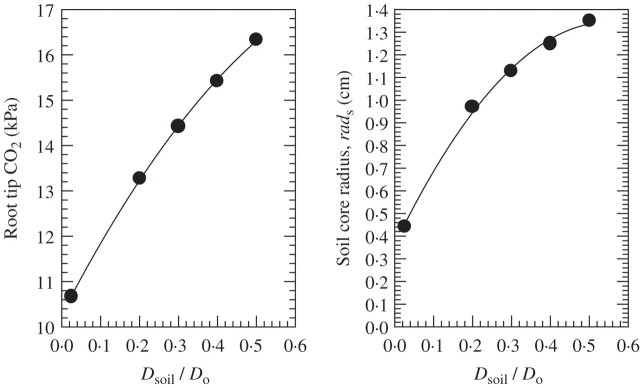
Scope: P(CO2) at 15-70 kPa has been reported for flooded paddy-field soils; however, even 15 kPa P(CO2) may not always be reached, e.g. when soil pH is above 7. Increases of P(CO2) in soils following waterlogging will develop much more slowly than decreases in P(O2); in soil from rice paddies in pots without plants, maxima in P(CO2) were reached after 2-3 weeks. There are no reliable data on P(CO2) in roots when in waterlogged or flooded soils. In rhizomes and internodes, P(CO2) sometimes reached 10 kPa, inferring even higher partial pressures in the roots, as a CO2 diffusion gradient will exist from the roots to the rhizomes and shoots. Preliminary modelling predicts that when P(CO2) is higher in a soil than in roots, P(CO2) in the roots would remain well below the P(CO2) in the soil, particularly when there is ventilation via a well-developed gas-space continuum from the roots to the atmosphere. The few available results on the effects of P(CO2) at > 5 kPa on growth have nearly all involved sudden increases to 10-100 kPa P(CO2); consequently, the results cannot be extrapolated with certainty to the much more gradual increases of P(CO2) in waterlogged soils. Nevertheless, rice in an anaerobic nutrient solution was tolerant to 50 kPa CO2 being suddenly imposed. By contrast, P(CO2) at 25 kPa retarded germination of some maize genotypes by 50%. With regard to metabolism, assuming that the usual pH of the cytoplasm of 7.5 was maintained, every increase of 10 kPa CO2 would result in an increase of 75-90 mM HCO3(-) in the cytoplasm. pH maintenance would depend on the biochemical and biophysical pH stats (i.e. regulatory systems). Furthermore, there are indications that metabolism is adversely affected when HCO3(-) in the cytoplasm rises above 50 mM, or even lower; succinic dehydrogenase and cytochrome oxidase are inhibited by HCO3(-) as low as 10 mM. Such effects could be mitigated by a decrease in the set point for the pH of the cytoplasm, thus lowering levels of HCO3(-) at the prevailing P(CO2) in the roots.

Conclusions: Measurements are needed on P(CO2) in a range of soil types and in roots of diverse species, during waterlogging and flooding. Species well adapted to high P(CO2) in the root zone, such as rice and other wetland plants, thrive even when P(CO2) is well over 10 kPa; mechanisms of adaptation, or acclimatization, by these species need exploration.


Figures

F<sc>ig</sc>. 1.
Fig. 1.
High partial pressures of CO2 occur in many waterlogged and flooded soils, particularly when pH < 7·0. Lack of ventilation leads to build up of high concentrations of dissolved inorganic carbon derived from catabolism by micro-organisms in the soil and by plant roots. CO2 and HCO3 levels in the roots will depend on the equilibrium between the input of CO2 and pathways which remove inorganic carbon to the shoots, i.e. diffusion in the gas phase of the roots and in some species by convective gas flow through rhizomes, as well as CO2 and HCO3 in the xylem stream. In species with rapid ventilation, and in a soil PCO2 of 40 kPa, PCO2 in roots is assessed at 13–26 kPa (see section in text on PCO2 in roots and rhizomes, and Table 3). Percolation may also remove dissolved inorganic carbon, at least in puddled rice soils and then would contribute substantially to mitigation of rises in soil PCO2. In some cases CO2 removal by diffusion to the atmosphere may become substantial, e.g. when PCO2 is 40 kPa and the rate of soil production is relatively low (e.g. 15 × 10–12 mol cm–3 s–1) (Appendix 2c and main text). CO2 may also be converted to CH4 (not shown), depending on soil redox (see text). Assumed is a pKa of 6·3 in the soil water. If pH of soil <6·3; then HCO3 < CO2 and increases in PCO2 will be relatively rapid. If pH of soil >6·3 than HCO3 > CO2 and increases in PCO2 will be relatively slow.
F<sc>ig</sc>. 2.
Fig. 2.
Carbonate speciation for total carbonate in a closed system, as influenced by pH. Note that at pH < 4, 100 % of the total dissolved inorganic carbon is H2CO3 (CO2 + H2O), at pH 8·0 HCO3 is at maximum and at high pH (i.e. >12) CO32– is at maximum. (courtesy of Dr John R Chipperfield, Emeritus Reader in Inorganic Chemistry, Department of Chemistry, University of Hull, Kingston upon Hull, UK). Based on the Henderson–Hasselbalch equation (Segel, 1976): pH = pKa + log(HCO3/CO2). pKa assumed for the calculation = 6·11, and pKa2 = 9·87. The locations of the curves relative to the pH scale will depend on the ionic strength of the solution (Yokota and Kitaoka, 1985). The example shown is for the assessed ionic strength of 0.1 m in the cytoplasm (Appendix 2a). The pKa may become ∼6·3 at the low ionic strength in some soil solutions and floodwaters. In an open system, the species distributions would vary as shown, but, of course, there may be increases in dissolved inorganic carbon, so that the molar concentration of CO2 can be relatively high even when pH is above ∼7·0.
F<sc>ig</sc>. 3.
Fig. 3.
PCO2 in flooded rice soils in pots without plants (Ponnamperuma, 1984), temperature unknown. PCO2 was calculated based on the Henderson–Hasselbalch equation; the data were obtained by sampling the soil solution and assessing HCO3 concentration using titration with methyl orange (pH range 3.0–5.0), and the pKa from the ionic strength in the soil solution. Such procedures may be in error if the soil solution contains weak acids other than CO2 (IRRI, 2005). It is not clear if, and in what way, the PCO2 values were corrected for the presence of organic acids; we have therefore not included in the table the few extremely high values measured for some soils. The value of 8 kPa in one of the soils before it was flooded (time 0) implies the soil had a very low gas-filled porosity under the experimental conditions.
F<sc>ig</sc>. 4.
Fig. 4.
Soil depth losing CO2 to the atmosphere as related to soil production rates and CO2 pressures in the soil, for soils saturated to the surface (open circles) or with 100 mm of stagnant water on the soil surface (filled circles). Predictions were based on the protocols in Appendix 2c. Msoil = metabolic rate of soil organisms = CO2 production rate in soil. The percentage of CO2 production in the soil lost to the atmosphere by diffusion would be the depth of the layer from which CO2 is lost, divided by the depth of the soil profile producing CO2.
F<sc>ig</sc>. 5.
Fig. 5.
Relationship between root porosity and RPCO2, when the bulk soil is at 40 kPa PCO2. Predictions were derived using the protocols in Appendix 3a. Conditions assumed are: CO2 production by the soil of 30 × 10−12 mol cm–3 s–1, PCO2 in the root required to ventilate CO2 production in the root of 10 kPa, root radius of 0·6 mm, root length of 100 mm and soil temperature of 30 °C. Other conditions are as in Table 3. Note that the PCO2 in the root due to influx from the soil would be the values shown minus 10 kPa.
F<sc>ig</sc>. 6.
Fig. 6.
Plots for root tip CO2 (RPCO2 in kPa) and soil core radius (rads) from which CO2 enters roots in waterlogged soil as predicted using the model presented in Appendix 3a, for a range of values of Dsoil/D0, and the following conditions: root length = 100 mm, site of entry into the root only the 10-mm root tip, CO2 production rate = 30 × 10−12 mol cm–3 soil s–1, root fractionial porosity = 0·35. This is the combination of soil and plant characteristics shown in column 2 of Table 3. The substantial effects of Dsoil/D0 (i.e. the product of soil porosity and tortuosity) on RPCO2 at the combination of soil and plant characteristics used would also apply to other combinations of characteristics of the soil–plant system (shown in Table 3); the magnitude of the effects on RPCO2 will differ in degree, but not in kind.

References

    1. Ahuja LR, Rawls WJ, Nielsen DR, Williams RD. 1999. Determining soil hydraulic properties and their field variability from simpler measurements. In: Skaggs RW, van Schilfgaarde J, eds. Agricultural drainage. Madison: American Society of Agronomy, 1207–1233.
    1. Alberts B, Johnson A, Lewis J, Raff M, Roberts K. 2002. Molecular biology of the cell, 4th edn. New York: Garland Science Publishers.
    1. Amthor JS. 1997. Plant respiratory responses to elevated carbon dioxide partial pressure. In: Allen LH, Kirkham MB, Olszyk DM, Whitman CE, eds. Advances in carbon dioxide effects research. Madison: American Society of Agronomy, 35–77.
    1. Andrews DL, Drew MC, Johnson JR, Cobb BG. 1994. The response of maize seedlings of different ages to hypoxic and anoxic stress. Changes in induction of ADH1 mRNA, ADH activity, and survival of anoxia. Plant Physiology 105: 53–60. - PMC - PubMed
    1. Armstrong W. 1979. Aeration in higher plants. Advances in Botanical Research 7: 225–332.