. 2006 Sep;35(3):347-56.
doi: 10.1165/rcmb.2005-0285OC. Epub 2006 Apr 27.

Pulmonary immune responses to Propionibacterium acnes in C57BL/6 and BALB/c mice

Affiliations

Pulmonary immune responses to Propionibacterium acnes in C57BL/6 and BALB/c mice

Joshua G McCaskill et al. Am J Respir Cell Mol Biol. 2006 Sep.

Abstract

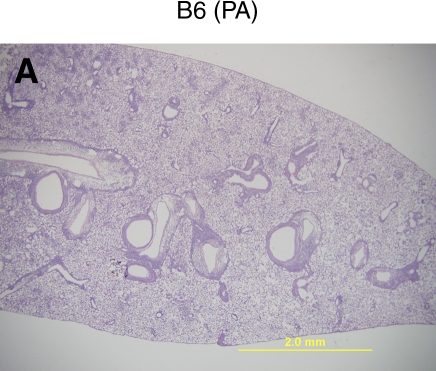
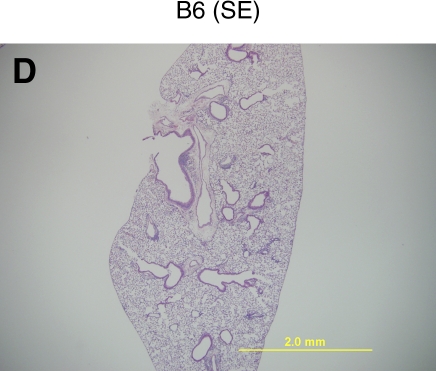
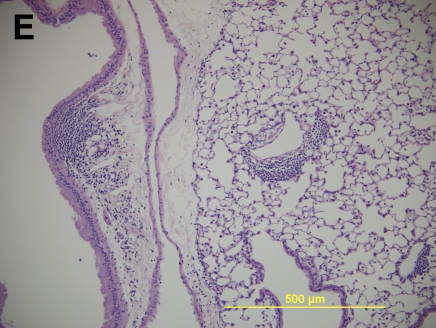
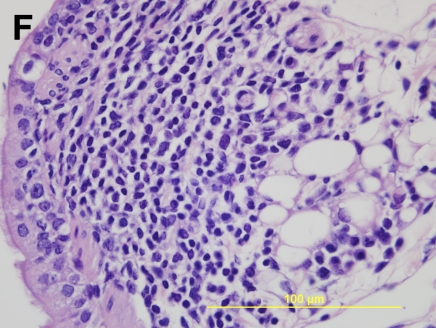
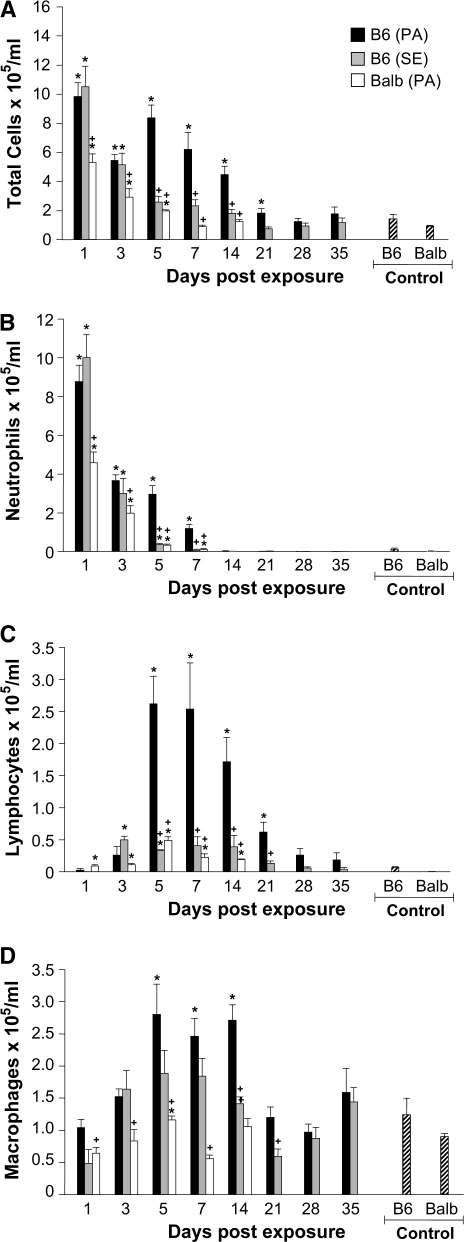
Propionibacterium acnes (PA) is a gram-positive anaerobic bacterium implicated as a putative etiologic agent of sarcoidosis. To characterize the pulmonary immune response to PA, C57BL/6 and BALB/c mice were intraperitoneally sensitized and intratracheally challenged with heat-killed bacteria. C57BL/6 mice challenged with PA developed a cellular immune response characterized by elevations in Th1 cytokines/chemokines, increased numbers of lymphocytes and macrophages in lung lavage fluid, and peribronchovascular granulomatous inflammation composed of T- and B-lymphocytes and epithelioid histiocytes. T-lymphocytes in the lung lavage fluid showed a marked CD4+ cell predominance. In contrast, C57BL/6 mice challenged with Staphylococcus epidermidis (SE), another gram-positive commensal of human skin, and BALB/c mice challenged with PA, showed only a modest induction of Th1 cytokines, less pulmonary inflammation, and no granulomatous changes in the lung. Enhancement of Toll-like receptor expression was seen in PA-exposed C57BL/6 mice within 24 h after exposure, suggesting that induction of innate immunity by PA contributes to the robust, polarized Th1 immune response elicited by this bacterium. These findings suggest that PA-induced pulmonary inflammation may be a useful model for testing the contributions of both bacterial and host factors in the development, maintenance, and resolution of granulomatous inflammation in the lung.


Figures

<b>Figure 1.</b>
Figure 1.
Lung histopathology 7 d after intratracheal challenge with PA and SE. C57BL/6 were intraperitoneally sensitized and challenged 2 wk later with heat-killed PA (A, B, C). Lung histopathology was compared with C57BL/6 mice sensitized/challenged with SE (D, E, F) and BALB/c mice sensitized/challenged with PA (G, H, I). Representative H&E-stained sections from each group are shown at magnifications of ×2 (A, D, G), ×10 (B, E, H), and ×60 (C, F, I).
<b>Figure 2.</b>
Figure 2.
Time course and characterization of leukocytes in the lung lavage fluid after sensitization and challenge with PA. PA sensitized/challenged C57BL/6 mice (solid bars) are compared with SE sensitized/challenged C57BL/6 mice (shaded bars) and PA sensitized/challenged BALB/c mice (open bars). Mice treated with intraperitoneal PBS and intratracheal PBS were used as controls (striped bars). (A) Total cells. (B) Neutrophils. (C) Lymphocytes. (D) Macrophages. Data are representative of three independent experiments and are expressed as mean cell number ± SEM. *P < 0.05 versus control mice of the same genetic background, +P < 0.05 versus PA-exposed C57BL/6 mice (n = 3–6 mice per group).
<b>Figure 3.</b>
Figure 3.
Effect of sensitization on leukocyte recruitment to the lung of C57BL/6 mice. Seven (A) and 14 (B) d after intratracheal challenge, mice sensitized and challenged with PA (black bars) were compared with mice intratracheally challenged but not sensitized (dark gray bars), mice sensitized but not challenged (light gray bars), and control mice that were neither sensitized nor challenged with PA (open bars). Data represent mean cell number recovered from each animal, ± SEM. *P < 0.05 versus intraperitoneal PBS/intratracheal PBS control mice, +P < 0.05 versus intraperitoneal PBS/intratracheal PA control mice (n = 3–4 mice per group).
<b>Figure 4.</b>
Figure 4.
Cell types present in peribronchovascular infiltrates of PA-exposed mice. Immunohistochemistry was performed on sections from formalin-fixed, paraffin-embedded lung from mice 7 d after intratracheal challenge with PA using antibodies against CD68 (A), CD4 (B), and CD45/B220 (C). Biotinylated secondary antibody was used with Streptravidin-HRP/DAB detection system with hematoxylin (A, B) and methylene green (C) counterstains.
<b>Figure 5.</b>
Figure 5.
Th1 cytokines in lung lavage and lung homogenates after sensitization and challenge with PA. TNF-α (A, B), IFN-γ (C, D), IL-12p40 (E, F), IL-12p70 (G, H) were measured by ELISA in the supernatant obtained from a 1-ml whole lung lavage (A, C, E, G) and in 5-ml lung homogenate protein extracts (B, D, F, H) from PA-sensitized/challenged C57BL/6 (solid bars), SE-sensitized/challenged C57BL/6 (shaded bars), and PA-sensitized/challenged BALB/c mice (open bars). Data represent mean cytokine level ± SEM. *P < 0.05 versus respective controls, +P < 0.05 versus C57BL/6 PA-exposed mice (n = 3–6 mice per group).
<b>Figure 6.</b>
Figure 6.
Th2 cytokines in the lung after sensitization and challenge with PA. Cytokine levels were measured in lung homogenate protein extracts by ELISA on the indicated days after challenge. IL-4 (A) and IL-13 (B) levels in C57BL/6 mice sensitized/challenged with PA (solid bars), C57BL/6 mice sensitized/challenged with SE (shaded bars), and IL-13 levels (B) in BALB/c mice sensitized/challenged with PA (open bars). Data represent mean cytokine level ± SEM. *P < 0.05 versus respective controls, +P < 0.05 versus C57BL/6 PA-exposed mice (n = 3–6 mice per group).
<b>Figure 7.</b>
Figure 7.
MCP-1 chemokine expression in the lung after sensitization and challenge with PA. MCP-1 mRNA expression (A), protein expression in lung homogenates (B), and protein levels in lung lavage fluid (C) in mice sensitized/challenged with PA (solid bars) and mice sensitized/challenged with SE (shaded bars). MCP-1 protein levels were also measured in BALB/c mice sensitized/challenged with PA (B, open bars). Data in A are expressed as fold-expression over controls, as determined by quantitative real-time PCR (comparative CT method), whereas data in B and C are MCP-1 levels as measured by ELISA (n = 3–6 mice per group; *P < 0.05 versus respective controls, +P < 0.05 versus C57BL/6 mice sensitized/challenged with PA).
<b>Figure 8.</b>
Figure 8.
TLR mRNA expression in the lungs of C57BL/6 mice sensitized and challenged with PA. TLR1 (A), TLR2 (B), TLR4 (C), and TLR9 (D) expression was determined by quantitative real-time PCR (comparative CT method). Data are expressed as fold-expression over controls exposed to PBS. *P < 0.05 versus respective controls, +P < 0.05 versus C57BL/6 mice sensitized/challenged with SE (n = 3–4 mice per group).

References

    1. Travis WD, Colby TV, Koss MN, Rosado-de-Christenson ML, Muller NL, King TE. Atlas of non-tumor pathology: non-neoplastic disorders of the lower respiratory tract, 2nd ed. Washington, DC: American Registry of Pathology and the Armed Forces Institute of Pathology; 2002.
    1. Danel C, Dewar A, Corrin B, Turner-Warwick M, Chretien J. Ultrastructural changes in bronchoalveolar lavage cells in sarcoidosis and comparison with the tissue granuloma. Am J Pathol 1983;112:7–17. - PMC - PubMed
    1. Katchar K, Wahlstrom J, Eklund A, Grunewald J. Highly activated T-cell receptor AV2S3(+) CD4(+) lung T-cell expansions in pulmonary sarcoidosis. Am J Respir Crit Care Med 2001;163:1540–1545. - PubMed
    1. Moller DR. Involvement of T cells and alterations in T cell receptors in sarcoidosis. Semin Respir Infect 1998;13:174–183. - PubMed
    1. Baughman RP, Lower EE, du Bois RM. Sarcoidosis. Lancet 2003;361: 1111–1118. - PubMed

Publication types

MeSH terms