

Classifying gene expression profiles from pairwise mRNA comparisons
- PMID: 16646797
- PMCID: PMC1989150
- DOI: 10.2202/1544-6115.1071
Classifying gene expression profiles from pairwise mRNA comparisons
Abstract
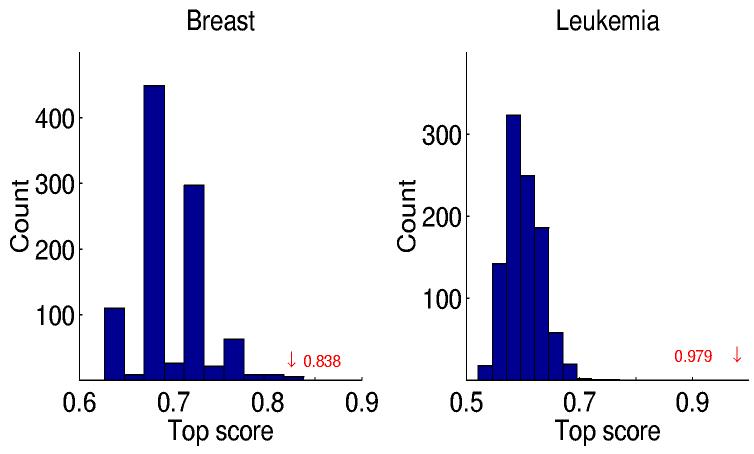
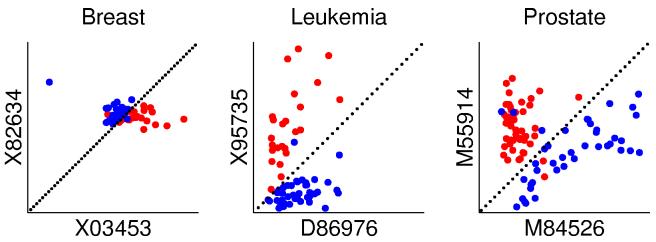
We present a new approach to molecular classification based on mRNA comparisons. Our method, referred to as the top-scoring pair(s) (TSP) classifier, is motivated by current technical and practical limitations in using gene expression microarray data for class prediction, for example to detect disease, identify tumors or predict treatment response. Accurate statistical inference from such data is difficult due to the small number of observations, typically tens, relative to the large number of genes, typically thousands. Moreover, conventional methods from machine learning lead to decisions which are usually very difficult to interpret in simple or biologically meaningful terms. In contrast, the TSP classifier provides decision rules which i) involve very few genes and only relative expression values (e.g., comparing the mRNA counts within a single pair of genes); ii) are both accurate and transparent; and iii) provide specific hypotheses for follow-up studies. In particular, the TSP classifier achieves prediction rates with standard cancer data that are as high as those of previous studies which use considerably more genes and complex procedures. Finally, the TSP classifier is parameter-free, thus avoiding the type of over-fitting and inflated estimates of performance that result when all aspects of learning a predictor are not properly cross-validated.
Figures
References
-
- Bicciato S, Pandin M, Didone G, Di Bello C. Pattern identification and classification in gene expression data using an autoassociative neural network model. Biotechnol. Bioeng. 2003;81(5):594–606. - PubMed
-
- Boulestiex AL, Tutz G, Strimmer K. A CART-based approach to discover emerging patterns in microarray data. Bioinformatics. 2003;19(18):2465–2472. - PubMed
-
- Bradstock KF, Kirk J, Grimsley PG, Kabral A, Hughes WG. Unusual immunophenotypes in acute leukemias: incidence and clinical correlations. Br. J. Haematol. 1989;72(4):512–518. - PubMed
Grants and funding
LinkOut - more resources
Full Text Sources
Other Literature Sources
Miscellaneous