. 2006 Apr 28:7:16.
doi: 10.1186/1471-2199-7-16.

Flexible promoter architecture requirements for coactivator recruitment

Affiliations

Flexible promoter architecture requirements for coactivator recruitment

Derek Y Chiang et al. BMC Mol Biol. .

Abstract

Background: The spatial organization of transcription factor binding sites in regulatory DNA, and the composition of intersite sequences, influences the assembly of the multiprotein complexes that regulate RNA polymerase recruitment and thereby affects transcription. We have developed a genetic approach to investigate how reporter gene transcription is affected by varying the spacing between transcription factor binding sites. We characterized the components of promoter architecture that govern the yeast transcription factors Cbf1 and Met31/32, which bind independently, but collaboratively recruit the coactivator Met4.

Results: A Cbf1 binding site was required upstream of a Met31/32 binding site for full reporter gene expression. Distance constraints on coactivator recruitment were more flexible than those for cooperatively binding transcription factors. Distances from 18 to 50 bp between binding sites support efficient recruitment of Met4, with only slight modulation by helical phasing. Intriguingly, we found that certain sequences located between the binding sites abolished gene expression.

Conclusion: These results yield insight to the influence of both binding site architecture and local DNA flexibility on gene expression, and can be used to refine computational predictions of gene expression from promoter sequences. In addition, our approach can be applied to survey promoter architecture requirements for arbitrary combinations of transcription factor binding sites.


Figures
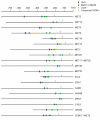
Figure 1
Figure 1
Promoter architectures of annotated sulfur-regulated genes. Conserved binding sites for Cbf1 (blue rectangles, TCACGTG), Met31 or Met32 (green circles, TGTGGC), Gcn4 (orangle triangles, TGA [C|G]TCA) and TBP (TATAA) are drawn to scale in the indicated intergenic regions. A binding site was considered conserved if invariant copies were aligned in at least 3 out of 4 closely-related Saccharomyces species in a multiple sequence alignment [24, 49].
Figure 2
Figure 2
Minimum distances between conserved Cbf1 and Met31/32 binding sites in annotated sulfur-regulated promoters. (A) Histogram of minimum distances between a Cbf1 binding site (TCACGTG) and a Met31/32 (TGTGGC) binding site. Distances were calculated from the center of each binding site, as indicated by the arrows between the consensus sequences. (B) Helical wheel projection of minimum distances. Cbf1 binding sites were aligned at the top of the helical wheel (position 0). Each green dot represents the remainder of a minimum distance from (A) divided by 10.5 bp. Since the helical pitch of DNA is 10.4 bp, each dot approximates the position of the Met31/32 binding site relative to the Cbf1 binding site. (C) Histogram of distances between the Met31/32 binding sites from (A) and the translation start site.
Figure 3
Figure 3
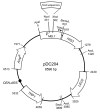
Synthetic promoter system. A minimal promoter from the MEL1 gene (PMEL1) was fused upstream of a HIS3 reporter gene on a single-copy plasmid. Selected restriction enzyme sites are labeled with their coordinates. Various combinations of Cbf1 and Met31/32 binding sites were inserted between the NcoI and XhoI restriction enzymes sites in the minimal promoter.
Figure 4
Figure 4
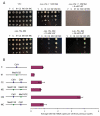
Reporter gene expression driven by various combinations of Cbf1 and Met31/32 binding sites. (A) Yeast strains were grown under either repressive (+Met) or activating (-Met) growth conditions, in addition to varying concentrations of the inhibitor, 3-AT. Each column represents a 10-fold serial dilution of a yeast strain containing a reporter plasmid with a different binding site combination, labeled as follows. V: vector alone, C: Cbf1 binding site, M: Met31/32 binding site, C2: Two Cbf1 binding sites spaced by 35 bp, M2: Two Met31/32 binding sites spaced by 35 bp, CM: Cbf1 binding site placed 35 bp upstream of a Met31/32 binding site, MC: Met31/32 binding site placed 35 bp upstream of a Cbf1 binding site. Yeast strains were grown on the indicated media for 5 days at 30°C. Serial dilutions were performed in triplicate, and a representative dilution is displayed for each growth condition. (B) Average inferred transcript levels in sulfur-limitation conditions associated with various promoter architectures. For each gene, the gene expression log ratio between sulfur limitation and complete media conditions was calculated as the average log base 2 expression ratio from previously published gene expression studies [28, 29]. To infer the average number of mRNA transcripts per cell, the gene expression ratio for each gene was multiplied by the basal transcript level as measured during growth in rich media [29]. Inferred transcript levels were averaged over sets of genes that shared the indicated binding site combinations in the 500 bp upstream of their translation start sites; the first row indicates the average for all genes. Error bars indicate the standard error of the mean.
Figure 5
Figure 5
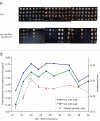
Average growth rates for sequence libraries with defined distances between Cbf1 and Met31/32 binding sites. We generated libraries of pooled transformants containing single-copy plasmids with the indicated distances between Cbf1 and Met31/32 binding sites. We induced reporter gene expression by transferring these pooled cultures into media lacking histidine, leucine and methionine, plus the indicated concentration of 3-AT (see Methods for details). The growth rate, expressed in doublings per hour, for each pooled culture was obtained from regular measurements of OD600. The average growth rate and standard error of the mean are plotted for three independent trials.
Figure 6
Figure 6
Different sequences between Cbf1 and Met31/32 binding sites show a range of reporter gene activation. (A) Serial dilutions of yeast containing reporter plasmids with the same distance (20 bp) between binding sites, but different spacer sequences. Yeast strains were grown on the indicated media for 5 days at 30°C. (B) Proportions of transformants that displayed moderate to high levels of growth on solid media with 10 mM or 25 mM 3-AT. For each distance between binding sites, growth rates of 72 transformants with different spacer sequences were assayed with serial dilutions. Average growth rates in liquid media with 1 mM 3-AT, as in Figure 4, is also shown for comparison purposes.
Figure 7
Figure 7
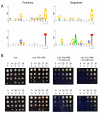
Sequence context effects were not determined by individual nucleotides. (A) Sequence logos for a sample of promoters with a center-to-center distance of 20 bp between Cbf1 and Met31/32 binding sites. At each position, the height of the nucleotide corresponds to the information content at that position, which weights its frequency in the sequenced sample compared with its expected frequency [31]. The sample was divided into sequences that supported or inhibited gene activation, as well as whether a guanine or thymine was found adjacent to the Met31/32 binding site. A separate logo was generated by WebLogo for each sub-sample [30]. Since three invariant nucleotides on both the 5' and 3' ends of the spacer sequence represented the Cbf1 and Met31/32 binding sites, respectively, only the central 14 bp are displayed. (B) Mutation of single nucleotides in positive promoters failed to inhibit reporter gene activation in vivo. Each column corresponds to a yeast strain containing a different spacer sequence with a distance of 20 bp between the binding sites. The clone number and nucleotide at position 11 are indicated above each panel. Ten-fold serial dilutions were performed in triplicate, and a representative dilution is shown.

References

    1. Carey M. The enhanceosome and transcriptional synergy. Cell. 1998;92:5–8. doi: 10.1016/S0092-8674(00)80893-4. - DOI - PubMed
    1. Merika M, Thanos D. Enhanceosomes. Curr Opin Genet Dev. 2001;11:205–208. doi: 10.1016/S0959-437X(00)00180-5. - DOI - PubMed
    1. Ogata K, Sato K, Tahirov TH. Eukaryotic transcriptional regulatory complexes: cooperativity from near and afar. Curr Opin Struct Biol. 2003;13:40–48. doi: 10.1016/S0959-440X(03)00012-5. - DOI - PubMed
    1. Remenyi A, Scholer HR, Wimanns M. Combinatorial control of gene expression. Nat Struct Mol Biol. 2004;11:812–817. doi: 10.1038/nsmb820. - DOI - PubMed
    1. van Helden J, Rios AF, Collado-Vides J. Discovering regulatory elements in non-coding sequences by analysis of spaced dyads. Nucleic Acids Res. 2000;28:1808–1818. doi: 10.1093/nar/28.8.1808. - DOI - PMC - PubMed

Publication types

MeSH terms

Substances

LinkOut - more resources