. 2006;8(3):R78.
doi: 10.1186/ar1948. Epub 2006 Apr 28.

Cyclooxygenases and prostaglandin E2 receptors in growth plate chondrocytes in vitro and in situ--prostaglandin E2 dependent proliferation of growth plate chondrocytes

Affiliations

Cyclooxygenases and prostaglandin E2 receptors in growth plate chondrocytes in vitro and in situ--prostaglandin E2 dependent proliferation of growth plate chondrocytes

Christoph Brochhausen et al. Arthritis Res Ther. 2006.

Abstract

Prostaglandin E2 (PGE2) plays an important role in bone development and metabolism. To interfere therapeutically in the PGE2 pathway, however, knowledge about the involved enzymes (cyclooxygenases) and receptors (PGE2 receptors) is essential. We therefore examined the production of PGE2 in cultured growth plate chondrocytes in vitro and the effects of exogenously added PGE2 on cell proliferation. Furthermore, we analysed the expression and spatial distribution of cyclooxygenase (COX)-1 and COX-2 and PGE2 receptor types EP1, EP2, EP3 and EP4 in the growth plate in situ and in vitro. PGE2 synthesis was determined by mass spectrometry, cell proliferation by DNA [3H]-thymidine incorporation, mRNA expression of cyclooxygenases and EP receptors by RT-PCR on cultured cells and in homogenized growth plates. To determine cellular expression, frozen sections of rat tibial growth plate and primary chondrocyte cultures were stained using immunohistochemistry with polyclonal antibodies directed towards COX-1, COX-2, EP1, EP2, EP3, and EP4. Cultured growth plate chondrocytes transiently secreted PGE2 into the culture medium. Although both enzymes were expressed in chondrocytes in vitro and in vivo, it appears that mainly COX-2 contributed to PGE2-dependent proliferation. Exogenously added PGE2 stimulated DNA synthesis in a dose-dependent fashion and gave a bell-shaped curve with a maximum at 10-8 M. The EP1/EP3 specific agonist sulprostone and the EP1-selective agonist ONO-D1-004 increased DNA synthesis. The effect of PGE2 was suppressed by ONO-8711. The expression of EP1, EP2, EP3, and EP4 receptors in situ and in vitro was observed; EP2 was homogenously expressed in all zones of the growth plate in situ, whereas EP1 expression was inhomogenous, with spared cells in the reserve zone. In cultured cells these four receptors were expressed in a subset of cells only. The most intense staining for the EP1 receptor was found in polygonal cells surrounded by matrix. Expression of receptor protein for EP3 and EP4 was observed also in rat growth plates. In cultured chrondrocytes, however, only weak expression of EP3 and EP4 receptor was detected. We suggest that in growth plate chondrocytes, COX-2 is responsible for PGE2 release, which stimulates cell proliferation via the EP1 receptor.


Figures
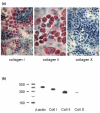
Figure 1
Figure 1
Collagen protein and mRNA expression in cultured rat growth plate chondrocytes. Isolated rat chondrocytes were cultured until confluency. (a) Protein expression for collagen I, II and X was studied in cultured chondrocytes with type-specific antibodies and using the alkaline-phosphatase-anti-alkaline-phosphatase method. Collagen type I was expressed in the majority of the cultured cells. Collagen II was strongly detected in chondrocytes of polygonal shape, representing more than 80% of the cultured cells. In cultured chondrocytes, no reactivity towards the collagen X antibody was observed. The antigens of the antibodies are indicated below the figures. (b) mRNA expression of the various collagen types. PCR analysis revealed expression of mRNA for collagen (Coll) I and collagen II and only marginal expression of collagen X mRNA.
Figure 2
Figure 2
Cyclooxygenase (COX) expression in cultured rat growth plate chondrocytes and in the growth plate. Expression of mRNA for COX-1 and COX-2 was analysed by reverse transcription RT-PCR. β-actin was used as positive control. Both growth plate tissue and cultured chondrocytes express mRNA for COX-1 and COX-2. bp, base-pairs.
Figure 3
Figure 3
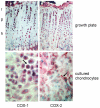
Cyclooxygenase (COX) expression in rat growth plate chondrocytes in vitro and in situ. Protein expression of COX-1 and COX-2 was studied using isoform-specific antibodies. Both COX isoforms could be detected in all zones of the growth plate. In cultured growth plate chondrocytes, COX-1 was expressed in all cultured chondrocytes with high intensity in paranuclear areas (marked by arrow). COX-2 protein was detected in extranuclear regions as well as in cell processes (marked by arrow) of a sub-population of the cultured cells only. r, reserve zone; p, proliferative zone; h, hypertrophic zone.
Figure 4
Figure 4
Proliferation assay with selective and unselective cyclooxygenase (COX) inhibitors. The effect of selective and unselective COX inhibitors on chondrocyte proliferation was assessed by [3H]-thymidine incorporation. Subconfluent chondrocytes were synchronized in serum-free medium for 24 hours. Medium was renewed and the indicated inhibitors were added for 24 hours: indo, 50 μM indomethacin; SC-560, 10 μM; SC-236, 10 μM. Data are given as mean ± standard error of the mean, n = 6; *p value < 0.05.
Figure 5
Figure 5
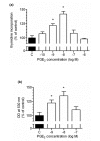
Effect of prostaglandin E2 (PGE2) on chondrocyte proliferation. (a) Proliferation of cultured chondrocytes was determined by [3H]-thymidine incorporation. Subconfluent chondrocytes were synchronized in serum-free medium for 24 hours. Medium was renewed and PGE2 or solvent was added in the indicated concentrations for 24 hours. Data are presented as mean ± standard error of the mean, n = 5. (b) Relative quantification of DNA in cultured chondrocytes was used as a measure for proliferation. Chondrocytes were grown in 96-well-plates until subconfluency. After synchronization, PGE2 or solvent was added for 24 hours. Thereafter, medium was aspirated, DNA was extracted by freeze-thawing and 200 μl of the staining solution (containing a fluorescent nucleic acid stain) were added and DNA-bound fluorophore was determined by fluorescence spectroscopy, expressed as OD at 530 nm. Data are presented as mean ± standard error of the mean of four parallel experiments, given as percent of the control. Excitation of the control was 14,705 ± 2,675 after 24 hours. *p value < 0.05.
Figure 6
Figure 6
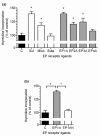
Effect of prostaglandin E (EP) receptor ligands on proliferation of cultured chondrocytes. (a) Unselective and selective EP receptor agonists were administered to cultured chondrocytes. Subconfluent chondrocytes were synchronized in serum-free medium for 24 hours and EP receptor agonists were added for 24 hours. Proliferation was assessed by [3H]thymidine incorporation. C, control; Sul, 1 μM sulprostone; Miso, 1 μM misoprostole; But, 1 μM butaprost; EP1A, 4 μM ONO-D1-004; EP2A, 0.1 μM ONO-AE1-259-01; EP3A, 0.1 μM ONO-AE-248; EP4A, 0.1 μM ONO-AE1-329. Data are given as mean ± standard error of the mean, n = 5. *P value < 0.05. (b) To study EP1 function for cell growth, a EP1 receptor selective agonist and antagonist were added to cultured chondrocytes. Subconfluent chondrocytes were synchronized in serum-free medium for 24 hours and EP1 receptor agonist (EP1A) or antagonist (EP1AN) combined with 10 nM prostaglandin E2 were added for 24 hours in the presence of [3H]-thymidine. EP1A, 4 μM ONO-D1-004; EP1AN, 1 μM ONO-8711. Data are given as mean ± standard error of the mean, n = 5. *P value < 0.05.
Figure 7
Figure 7
Expression of EP1 and EP2 receptors in rat growth plates and in cultured chondrocytes at the mRNA level. Expression of mRNA for EP1 and EP2 receptors was analysed by reverse transcription RT-PCR. β-actin was used as a positive control. Both growth plate tissue and cultured chondrocytes express mRNA for EP1 and EP2.
Figure 8
Figure 8
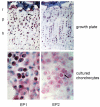
Immunohistochemical detection of EP1 and EP2 receptor in rat growth plates and in cultured chondrocytes. Protein expression of EP1 and EP2 receptor was studied using isoform-specific antibodies. The EP1 receptor showed strong expression in the proliferative and hypertrophic zone but marginal expression in the reserve zone, with some negative cells (marked by arrow). In contrast, the EP2 receptor was distributed throughout the whole growth plate. In vitro the EP1 and EP2 receptors were only expressed in subpopulations. EP1 showed strong positivity in chondrocytes organised in a cobblestone pattern and surrounded by matrix, whereas fibroblastic-shaped cells were only occasionally and moderately positive for EP1. The highest expression for EP2 could be demonstrated in dividing cells and polygonal cells embedded in matrix (marked by arrow). In fibroblastic cells, only minimal to slight positivity was found in a small number of cells. Magnification 200 × . r, reserve zone; p, proliferative zone; h, hypertrophic zone.
Figure 9
Figure 9
Expression of EP3 and EP4 receptor mRNA in rat growth plates and in cultured chondrocytes. Expression of mRNA for EP3 and EP4 receptor was analysed by RT-PCR. β-actin was used as positive control. Both growth plate tissue and cultured chondrocytes express mRNA for EP3 and EP4.
Figure 10
Figure 10
Immunohistochemical detection of EP3 and EP4 receptor proteins in rat growth plates and in cultured chondrocytes. Protein expression of EP3 and EP4 receptor was studied in growth plate tissue and cultured chondrocytes using isoform-specific antibodies. The EP3 and EP4 receptors were distributed throughout the whole growth plate. Cultured chondrocytes exhibited only weak reactivity towards the anti-EP antibodies. Only a minor subpopulation of cells showed strong staining for EP3 receptor and EP4 receptor. Magnification: 200 × . r, reserve zone; p, proliferative zone; h, hypertrophic zone.

Similar articles

Cited by

References

    1. Klein DC, Raisz LG. Prostaglandins: stimulation of bone resorption in tissue culture. Endocrinology. 1970;86:1436–1440. - PubMed
    1. Flanagan AM, Chambers TJ. Stimulation of bone nodule formation in vitro by prostaglandins E1 and E2. Endocrinology. 1992;130:443–448. doi: 10.1210/en.130.1.443. - DOI - PubMed
    1. Weinreb M, Rutledge SJ, Rodan GA. Systemic administration of an anabolic dose of prostaglandin E(2) induces early-response genes in rat bones. Bone. 1997;20:347–353. doi: 10.1016/S8756-3282(97)00011-2. - DOI - PubMed
    1. Igarashi K, Hirafuji M, Adachi H, Shinoda H, Mitani H. Role of endogenous PGE2 in osteoblastic functions of a clonal osteoblast-like cell, MC3T3-E1. Prostaglandins Leukot Essent Fatty Acids. 1994;50:169–172. doi: 10.1016/0952-3278(94)90140-6. - DOI - PubMed
    1. Lowe GN, Fu YH, McDougall S, Polendo R, Williams A, Benya PD, Hahn TJ. Effects of prostaglandins on deoxyribonucleic acid and aggrecan synthesis in the RCJ 3.1C5.18 chondrocyte cell line: role of second messengers. Endocrinology. 1996;137:2208–2216. doi: 10.1210/en.137.6.2208. - DOI - PubMed