

Global environmental data for mapping infectious disease distribution
- PMID: 16647967
- PMCID: PMC3154638
- DOI: 10.1016/S0065-308X(05)62002-7
Global environmental data for mapping infectious disease distribution
Abstract
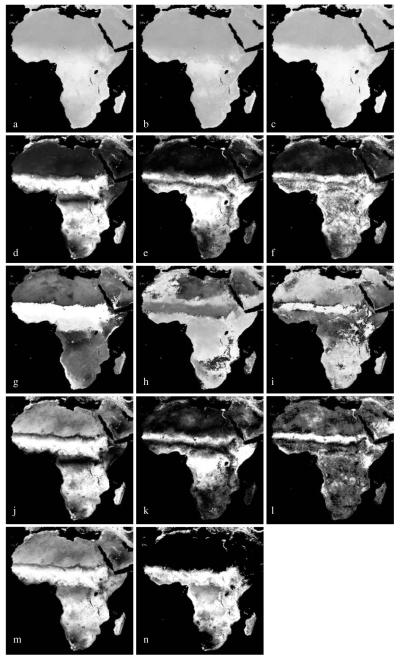
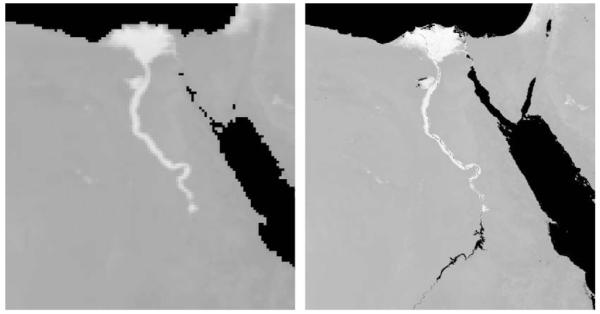
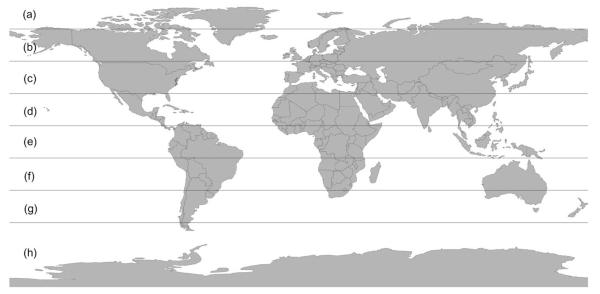
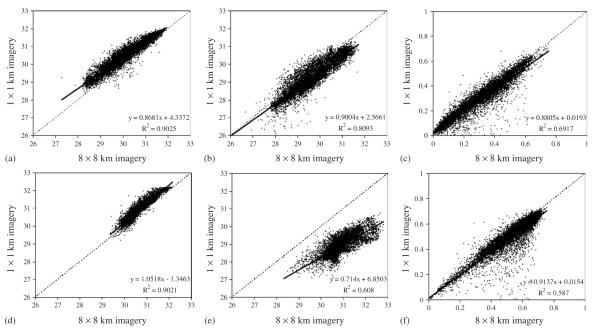
This contribution documents the satellite data archives, data processing methods and temporal Fourier analysis (TFA) techniques used to create the remotely sensed datasets on the DVD distributed with this volume. The aim is to provide a detailed reference guide to the genesis of the data, rather than a standard review. These remotely sensed data cover the entire globe at either 1 x 1 or 8 x 8 km spatial resolution. We briefly evaluate the relationships between the 1 x 1 and 8 x 8 km global TFA products to explore their inter-compatibility. The 8 x 8 km TFA surfaces are used in the mapping procedures detailed in the subsequent disease mapping reviews, since the 1 x 1 km products have been validated less widely. Details are also provided on additional, current and planned sensors that should be able to provide continuity with these environmental variable surfaces, as well as other sources of global data that may be used for mapping infectious disease.
Figures
References
-
- Anderson RM. Epidemiology. In: Cox FEG, editor. Modern Parasitology. 2nd ed Oxford; Blackwell: 1993. pp. 75–116.
-
- Campbell JB. Introduction to Remote Sensing. 3rd ed Taylor & Francis; London: 2002.
-
- Chander G, Helder DL, Markham BL, Dewald JD, Kaita E, Thome KJ, Micijevic E, Ruggles TA. Landsat-5 TM reflective-band absolute radiometric calibration. IEEE Transactions on Geoscience and Remote Sensing. 2004;42:2747–2760.
-
- Cracknell AP. The Advanced Very High Resolution Radiometer. Taylor & Francis; London: 1997.
-
- Draeger WC, Holm TM, Lauer DT, Thompson RJ. The availability of Landsat data: past, present and future. Photogrammetric Engineering & Remote Sensing. 1997;63:869–875.
Publication types
MeSH terms
Grants and funding
LinkOut - more resources
Full Text Sources
Medical
