Review
. 2006:62:157-79.
doi: 10.1016/S0065-308X(05)62005-2.

Defining the global spatial limits of malaria transmission in 2005

Affiliations
Review

Defining the global spatial limits of malaria transmission in 2005

C A Guerra et al. Adv Parasitol. 2006.

Abstract

There is no accurate contemporary global map of the distribution of malaria. We show how guidelines formulated to advise travellers on appropriate chemoprophylaxis for areas of reported Plasmodium falciparum and Plasmodium vivax malaria risk can be used to generate crude spatial limits. We first review and amalgamate information on these guidelines to define malaria risk at national and sub-national administrative boundary levels globally. We then adopt an iterative approach to reduce these extents by applying a series of biological limits imposed by altitude, climate and population density to malaria transmission, specific to the local dominant vector species. Global areas of, and population at risk from, P. falciparum and often-neglected P. vivax malaria are presented for 2005 for all malaria endemic countries. These results reveal that more than 3 billion people were at risk of malaria in 2005.


Figures

Plate 5
Plate 5
Malaria distribution in 2005 after altitudinal and population exclusions indicating areas at risk according to species of Plasmodium.
Plate 5
Plate 5
A–R First level administrative division boundaries and P. falciparum (Pf) and P. vivax (Pv) ratios by WHO region (A–C: AFRO; D–F: AMRO; G–I: EMRO; J–L: EURO; M–O: SEARO; P–R: WPRO). Outlined in thick black line are countries belonging to each region. Malarious countries are filled in light blue with a light grey thin line representing sub-national boundaries. Dark grey areas represent malaria distribution outside the given region and light grey ones are malaria-free areas.
Plate 5
Plate 5
A–R First level administrative division boundaries and P. falciparum (Pf) and P. vivax (Pv) ratios by WHO region (A–C: AFRO; D–F: AMRO; G–I: EMRO; J–L: EURO; M–O: SEARO; P–R: WPRO). Outlined in thick black line are countries belonging to each region. Malarious countries are filled in light blue with a light grey thin line representing sub-national boundaries. Dark grey areas represent malaria distribution outside the given region and light grey ones are malaria-free areas.
Figure 3
Figure 3
A–D Bar charts showing area (A and B) and population at risk (PAR) (C and D) of malaria according to the WHO 2002 limits (white), ITHGs (grey), and the progressive implementation of our altitudinal (dark grey) population (black) masks, globally and stratified by WHO regional office. The scales of area (km2) and population are in millions. Figures were calculated using ArcView 3.2 (ESRI, Redlands, California, USA). Area extractions were undertaken on an equal area projection.

References

    1. Bates I, Fenton C, Gruber J, Lalloo D, Lara A. Medina, Squire SB, Theobald S, Thomson R, Tolhurst R. Vulnerability to malaria, tuberculosis, and HIV/AIDS infection and disease. Part 1: determinants operating at individual and household level. Lancet Infectious Diseases. 2004;4:267–277. - PubMed
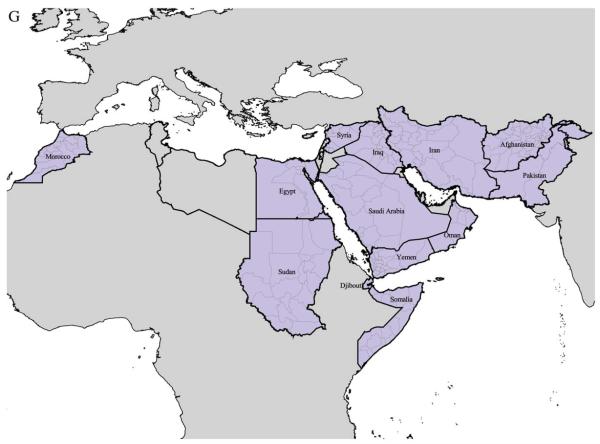
    1. Beljaev AE. Determinants of malaria in the Middle East and North Africa. In: Casman EA, Dowlatabadi H, editors. The Contextual Determinants of Malaria. Resources for the Future Press; Washington, DC: 2002. pp. 137–166.
    1. Boyd MF. Malariology. W.B. Saunders; Philadelphia: 1949.
    1. Carter R, Mendis KN. Evolutionary and historical aspects of the burden of malaria. Clinical Microbiology Reviews. 2002;15:564–594. - PMC - PubMed
    1. CDC . Health information for international travel 2003– 2004. Centers for Disease Control and Prevention; Atlanta: 2003.

Publication types

LinkOut - more resources