. 2006 Jul 15;91(2):518-36.
doi: 10.1529/biophysj.106.084285. Epub 2006 Apr 28.

Ion-mediated nucleic acid helix-helix interactions

Affiliations

Ion-mediated nucleic acid helix-helix interactions

Zhi-Jie Tan et al. Biophys J. .

Abstract

Salt ions are essential for the folding of nucleic acids. We use the tightly bound ion (TBI) model, which can account for the correlations and fluctuations for the ions bound to the nucleic acids, to investigate the electrostatic free-energy landscape for two parallel nucleic acid helices in the solution of added salt. The theory is based on realistic atomic structures of the helices. In monovalent salt, the helices are predicted to repel each other. For divalent salt, while the mean-field Poisson-Boltzmann theory predicts only the repulsion, the TBI theory predicts an effective attraction between the helices. The helices are predicted to be stabilized at an interhelix distance approximately 26-36 A, and the strength of the attractive force can reach -0.37 k(B)T/bp for helix length in the range of 9-12 bp. Both the stable helix-helix distance and the strength of the attraction are strongly dependent on the salt concentration and ion size. With the increase of the salt concentration, the helix-helix attraction becomes stronger and the most stable helix-helix separation distance becomes smaller. For divalent ions, at very high ion concentration, further addition of ions leads to the weakening of the attraction. Smaller ion size causes stronger helix-helix attraction and stabilizes the helices at a shorter distance. In addition, the TBI model shows that a decrease in the solvent dielectric constant would enhance the ion-mediated attraction. The theoretical findings from the TBI theory agree with the experimental measurements on the osmotic pressure of DNA array as well as the results from the computer simulations.


Figures

FIGURE 1
FIGURE 1
The tightly bound regions around two parallel 12-bp B-DNA helices in a divalent ion solution with different interaxis separations: (a) 50 Å; (b) 36 Å; and (c) 22 Å. The divalent salt concentration is 0.1 M and the cation radius is 3.5 Å. The red spheres represent the phosphate groups and the green dots represent the points at the boundaries of the tightly bound regions. The B-DNA helices are produced from the grooved primitive model (83,84,118).
FIGURE 2
FIGURE 2
The free energy ΔG(x), the electrostatic energy ΔGE(x), and the entropic free energy ΔGS(x), calculated from the TBI theory, as functions of the interhelix separation x for 0.01 M divalent salt concentration. The minimum contact distance for parallel helices is ∼x formula image 20 Å.
FIGURE 3
FIGURE 3
Illustrations for divalent ion binding to two parallel DNA helices for different interaxis separations: (a) x = 24 Å and (b) x = 50 Å. The circles represent the phosphates; the numbers in circles are the mean charge neutralization fraction of the tightly bound ions; the shaded circles represent the ion-binding phosphates for the most probable mode (with highest probability pM). Here, the divalent ion concentration is 0.01 M.
FIGURE 4
FIGURE 4
(a) The free energy ΔG(x) as a function of interhelix separation x for different monovalent salt concentrations: 0.01 M, 0.1 M, and 0.6 M (from top to bottom). (Dotted lines) Poisson-Boltzmann theory. (Solid lines) TBI theory. Some parts of the dotted lines are not visible because they are underneath the solid lines. (b) The electrostatic free energy ΔG(x) as a function of interhelix separation x for different divalent salt concentrations: 0.001 M, 0.01 M, and 0.1 M (from top to bottom). (Dotted lines) Poisson-Boltzmann theory. (Solid lines) TBI theory. The inset shows ΔG(x) at high divalent salt concentration. (c) The electrostatic energy ΔGE(x) (solid lines) and entropic free energy ΔGS(x) (shaded lines) for different monovalent salt concentrations. (d) The electrostatic energy ΔGE(x) and entropic free energy ΔGS(x) for different divalent salt concentrations. The inset shows ΔGE(x) and ΔGS(x) at high divalent salt concentrations. The minimum contact distance for parallel helices is ∼x formula image 20 Å.
FIGURE 5
FIGURE 5
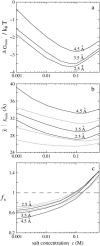
(a) The minimum free energy ΔGmin as a function of divalent salt concentration for variant cation radii: 4.5, 3.5, and 2.5 Å (from top to bottom). (b) The equilibrium interhelix separation formula image (solid lines) and xmin (dotted lines) corresponding to minimum free energy ΔGmin as functions of divalent salt concentration for different cation radii: 4.5, 3.5, and 2.5 Å (from top to bottom). (c) The mean charge neutralization fraction fb of the tightly bound ions per phosphate as a function of divalent salt concentration for different cation radii: 4.5, 3.5, and 2.5 Å (from the top to bottom). The interaxis separations are 50 Å (solid lines) and 26 Å (dotted lines), respectively.
FIGURE 6
FIGURE 6
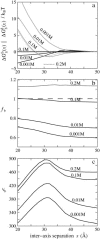
(a) The entropic free energies formula image of diffusive ions (black lines) and the entropic free energy formula image of the tightly bound ions (shaded lines) as functions of interhelix separation x for different divalent salt concentrations. (b) The mean charge neutralization fraction fb of the tightly bound ions per phosphate as a function of interhelix separation x for variant divalent salt concentrations. (c) The mean volumes vb (in Å3) of the tightly bound region per phosphate versus interhelix separation x for different divalent salt concentrations. The minimum contact distance for parallel helices is ∼x formula image 20 Å.
FIGURE 7
FIGURE 7
(a) The free energy ΔG(x) as a function of interhelix separation x for different divalent ion radii: 4.5 Å, 3.5 Å, and 2.5 Å (from top to bottom). The divalent salt concentration is 0.01 M. (Dotted lines) Poisson-Boltzmann theory. (Solid lines) TBI theory. (b) The electrostatic energy ΔGE(x) (solid lines) and entropic free energy ΔGS(x) (shaded lines) for different divalent ion radii. The divalent salt concentration is 0.01 M. (Solid lines) TBI theory. (Symbols) Monte Carlo simulations. (c) The mean charge neutralization fraction fb of the tightly bound ions per phosphate as a function of interhelix separation x for different cation sizes. (d) The mean volume vb (in Å3) of the tightly bound regions per phosphate as a function of interhelix separation x for different divalent cation sizes. The minimum contact distance for parallel helices is ∼x formula image 20 Å.
FIGURE 8
FIGURE 8
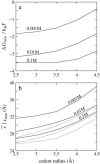
(a) The minimum free energy ΔGmin versus divalent ion radius for different divalent salt concentrations: 1 mM, 10 mM, and 100 mM (from top to bottom); (b) The equilibrium interhelix separation formula image (solid lines) and xmin (dotted lines) corresponding to minimum free energy ΔGmin as a function of cation radius for different divalent salt concentrations: 1 mM, 10 mM, and 100 mM (from top to bottom).
FIGURE 9
FIGURE 9
(a) The free energy ΔG(x), calculated from the TBI theory, as a function of interhelix separation x for different solvent dielectric constants ε: 90, 78, and 70 (from top to bottom). (b) The electrostatic energy ΔGE(x) (solid lines) and entropic free energy ΔGS(x) (shaded lines) for different solvent dielectric constant ε. (c) The mean charge neutralization fraction fb of the tightly bound ions per phosphate as a function of interhelix separation x for different solvent dielectric constants. (d) The mean volume vb (in Å3) of the tightly bound regions per phosphate as a function of interhelix separation x for different solvent dielectric constants. The divalent salt concentration is 0.01 M. The minimum contact distance for parallel helices is ∼x formula image 20 Å.
FIGURE 10
FIGURE 10
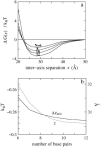
(a) The free energy ΔG(x), calculated from the TBI theory, as a function of interhelix separation x for different DNA helical lengths: 6, 8, 10, and 12 bp (from top to bottom). The divalent salt concentration is 0.01 M. The value ∼x formula image 20 Å is the minimum contact for parallel helices. (b) The minimum electrostatic free energy per basepair Δgmin (= ΔGmin/N; left y-axis) and the equilibrium interhelix separation formula image (right y-axis), calculated from the TBI theory, as functions of DNA length (basepair) per helix.
FIGURE 11
FIGURE 11
(a) Illustration for hexagonally ordered DNA array (from top view). The shaded circles represent the DNA helices, and the hexagonal area denoted by light shading is the cross area per molecule. (b) The osmotic pressures of DNA array as functions of interhelix separation x for different NaCl and MnCl2 concentrations. Symbols are experimental data: ⋄, 5 mM MnCl2 (97); ▵, 50 mM MnCl2 (97); □, 0.1 M NaCl (111); and +, 0.5 M NaCl (111). Solid lines are calculated from the TBI theory together with the use of Eq. 27. The temperature is at 20°C. (c) The osmotic pressures for divalent ions with different radii: 3.5 Å, 4.3 Å, and 4.5 Å (from left to right). Symbols are experimental data: ⋄, 10 mM MnCl2 (97); +, 10 mM CaCl2 (97); and □, 10 mM Putrescine Cl2 (97). Solid lines are calculated from the TBI theory and with Eq. 27. The temperature is at 20°C. (d) The osmotic pressures for 50 mM MnCl2 at different bath temperatures: 5°C, 20°C, and 50°C (from left to right). Symbols are experimental data: ⋄, 5°C (97); +, 20°C (97); and □, 50°C (97). Solid lines are calculated from the TBI theory with the use of Eq. 27. The minimum contact distance for parallel helices is ∼x formula image 20 Å.
FIGURE 12
FIGURE 12
The free energy G (Eq. 12), calculated from the TBI theory, versus DNA length N(−bp) for different divalent ion concentrations: 0.01 M and 0.1 M (from top to bottom). (Solid lines) Calculated with the use of Eq. 29; ΔEc = 4 kBT and M0 = 6N4. (Dotted lines) Calculated with the use of Eq. 29; ΔEc = 3 kBT and M0 = 4N4. (Symbols) Calculated through the exact enumeration on binding modes.

Similar articles

Cited by

References

    1. Bloomfield, V. A., D. M. Crothers, and I. Tinoco, Jr. 2000. Nucleic Acids: Structure, Properties and Functions. University Science Books, Sausalito, CA.
    1. Tinoco, I., and C. Bustamante. 1999. How RNA folds. J. Mol. Biol. 293:271–281. - PubMed
    1. Anderson, C. F., and M. T. Record, Jr. 1995. Salt-nucleic acid interactions. Annu. Rev. Phys. Chem. 46:657–700. - PubMed
    1. Sosnick, T. R., and T. Pan. 2003. RNA folding: models and perspectives. Curr. Opin. Struct. Biol. 13:309–316. - PubMed
    1. Woodson, S. A. 2005. Metal ions and RNA folding: a highly charged topic with a dynamic future. Curr. Opin. Chem. Biol. 9:104–109. - PubMed

Publication types

LinkOut - more resources