. 2006 Jul 15;91(2):496-507.
doi: 10.1529/biophysj.106.083394. Epub 2006 Apr 28.

Modeling Hsp70-mediated protein folding

Affiliations

Modeling Hsp70-mediated protein folding

Bin Hu et al. Biophys J. .

Abstract

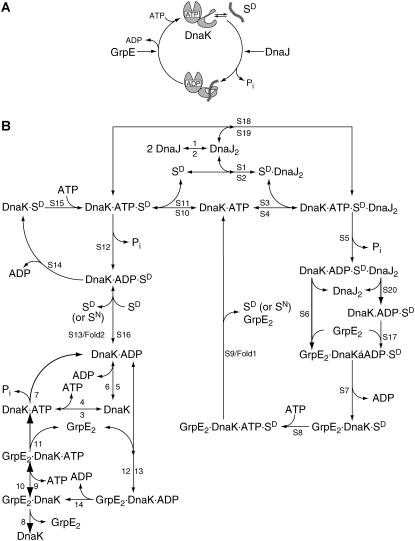
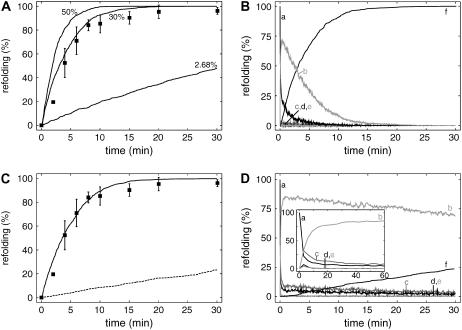
The Hsp70 chaperone system is the major molecular chaperone system that assists protein-folding processes in all cells. To understand these processes, we analyzed the kinetic characteristics of the Escherichia coli homologs of this chaperone system during folding of a denatured protein using computer simulations and compared the results with in vitro refolding experiments. Rate constants used for the model were derived from recent literature or were determined and scrutinized for their applicability to the refolding reaction. Our simulation results are consistent with reported laboratory experiments, not only simulating the refolding reaction of wild-type proteins but also the behavior of mutant variants. Variation of kinetic parameters and concentrations of components of the Hsp70 system demonstrate the robustness of the chaperone system in assisting protein folding. Furthermore, the importance of the synergistic stimulation of the ATPase activity of Hsp70 is demonstrated. The limitations of our kinetic model indicate sore spots in our understanding of this chaperone system. Our model provides a platform for further research on chaperone action and the mechanism of chaperone-assisted refolding of denatured proteins.


Figures

FIGURE 1
FIGURE 1
DnaK chaperone cycle. (A) Schematic ATPase cycle of the DnaK system. (B) Elemental chemical equations for the refolding of a denatured protein substrate SD by the DnaK system. With a certain probability the substrate SD can be refolded to the native state SN within any given cycle of binding, ATP hydrolysis, and release simulated as alternative reactions at the indicated positions. Numbers at the arrows indicate the reaction number in Table 1, where by, at horizontal arrows, the top number indicates the reaction from left to right, and the bottom number indicates the reaction from right to left; at vertical arrows, the left number indicates the reaction from top to bottom, and the right number indicates the reverse reaction.
FIGURE 2
FIGURE 2
Refolding probability and model validation. (A) Refolding reaction in dependence of refolding probability as indicated. Experimental data of in vitro refolding chemically denatured luciferase (▪; data from (13)). Error bars represent standard deviation of three independent experiments. (B) Distribution of the substrate between the different pools: (a) SD; (b) DnaK·ATP·SD; (c) DnaK·ADP·SD·DnaJ2; (d), DnaK·ATP·SD·DnaJ2; (e) GrpE2·DnaK·ATP·SD; and (f) SN. (C) Dependence of ATP consumption on refolding probability as indicated. Basal ATP consumption of the system without substrate (dashed line).
FIGURE 3
FIGURE 3
Critical parameters for the refolding reaction. (A) Dependence of refolding efficacy on the bimolecular rate constants for the reactions DnaK·ATP + SD·DnaJ2 → DnaK·ATP·SD·DnaJ2 and SD + DnaK·ATP → DnaK·ATP·SD as indicated (M−1 s−1). Symbols represent experimental data for DnaK wild-type (▪, same data as in Fig. 2 A) and DnaK-M404A (•) and DnaK-V436F (▴) mutant proteins, which are defective in their interaction with substrates to different degrees (data from (13)). Error bars represent standard deviation of three independent experiments. Error bars for the DnaK-V436F mutants are too small to be visible. (B) Dependence of refolding efficacy on the bimolecular rate for association of DnaJ2 to SD and to DnaK·ATP·SD, which were varied simultaneously as indicated (M−1 s−1). Experimental data (▪; same as in Fig. 2 A). (C) Importance of the individual reaction of DnaJ2 association to SD (b) and DnaK·ATP·SD (c) with an association rate of 30 M−1 s−1 as compared to the wild-type situation of a rate of 3.3 × 10⁵ M−1 s−1 (a). (D) Importance of synergistic stimulation of the ATP hydrolysis rate of DnaJ and substrate. Dashed and dashed-dotted lines represent simulations without stimulation of the ATPase activity of DnaK. The solid line corresponds to the simulation result for wild-type DnaK. The ATPase rates were set to the basal ATPase rate (0.0006 s−1, dashed line) or fully stimulated rate (1.8 s−1, dashed-dotted line). Symbols represent experimental data for DnaK wild-type (▪) and DnaK-P143G (▴) mutant proteins, for which the stimulated ATPase activity is close to the basal activity for the wild-type protein (data from (25)). (E) ATP consumption for the wild-type (khyd stimulated; same as in Fig. 2 C) and the always fully active (khyd = 1.8 s−1) DnaK proteins. Basal ATP consumption in the wild-type situation (dashed curve; same as in Fig. 2 C). (F) dependence of refolding efficacy on the bimolecular rate for the reactions DnaK·ADP + GrpE2 → GrpE2·DnaK·ADP, DnaK·ADP·SD·DnaJ2 + GrpE2 → GrpE2·DnaK·ADP·SD + DnaJ2, and DnaK·ADP·SD + GrpE2 → GrpE2·DnaK·ADP·SD as indicated (M−1 s−1). Experimental data for the wild-type situation (▪; same data as in Fig. 2 A). The refolding probability was kept constant at 2.68% for all simulations.
FIGURE 4
FIGURE 4
Robustness of the DnaK system. (A) Refolding reactions at different DnaJ concentrations as indicated (nM). (B) Dependence of refolding yields after 30 min on DnaJ concentrations. Simulations (▪); Experimental data (•; from (10)). (C) Refolding reactions at different GrpE concentrations as indicated (nM). (D) Dependence of refolding yields after 30 min on GrpE concentrations. Simulations (gray bars); experimental data (black bars; from (9)). (E) Refolding reactions at different DnaK concentrations as indicated (nM). (F) Dependence of refolding yields after 10 min on DnaK concentrations. Simulations (▴); experimental data (▪; from (13)). Error bars represent standard deviation of three independent experiments.
FIGURE 5
FIGURE 5
Variations of the refolding model. (A and B) Simulating the refolding reaction with low association rates for the interaction of DnaK·ATP with substrates. (A) The refolding reaction is shown in dependence of refolding probability as indicated with the bimolecular rate for the association of SD and SD·DnaJ2 to DnaK·ATP (reactions S3 and S10) set to 4000 M−1 s−1 (compared to 4.5 × 10⁵ M−1 s−1 in the original model). Experimental data of in vitro refolding chemically denatured luciferase (▪; data from (13); same as in Fig. 2 A). (B) Distribution of the substrate between the different pools in the refolding reaction shown in A at a refolding probability of 30%: a, SD; b, SD·DnaJ2; c, DnaK·ADP·SD·DnaJ2; d, GrpE2·DnaK·ATP·SD; e, DnaK·ATP·SD; and f, SN. (C and D) Dependence of the refolding reaction on the exit point of DnaJ. (C) Elimination of reaction S6 reduces refolding efficacy significantly. Kinetic model including reaction S6 (solid line); Kinetic model without reaction S6 (dashed line). In vitro refolding of chemically denatured luciferase (▪; data from (13); same as in Fig. 2 A). (D) distribution of the substrates between different pools in the refolding process without reaction S6 as shown in C (dashed line): a, SD; b, DnaK·ADP·SD·DnaJ2; c, DnaK·ATP·SD; d, DnaK·ATP·SD·DnaJ2; e, SD·DnaJ2; and f, SN.
FIGURE 6
FIGURE 6
Simulating a reduced refolding yield. Introduction of the reaction SD → SD*, with SD* not being a substrate for DnaK, and DnaJ simulates the refolding yields lower than 100% observed in experimental data in vitro. Refolding reactions with bimolecular rate constants for the reactions DnaK·ATP + SD·DnaJ2 → DnaK·ATP·SD·DnaJ2 and SD + DnaK·ATP → DnaK·ATP·SD as indicated with (solid lines) and without (dashed lines) the reaction SD → SD* at a rate of 7 × 10⁻⁴ s−1. Symbols represent experimental data for DnaK wild-type (▪) and DnaK-M404A (•) (data from (13) same as in Fig. 3 A).

Similar articles

Cited by

References

    1. Gething, M. J. 1991. Molecular chaperones: individualists or groupies? Curr. Opin. Cell Biol. 3:610–614. - PubMed
    1. Langer, T., G. Pfeifer, J. Martin, W. Baumeister, and F.-U. Hartl. 1992. Chaperonin-mediated protein folding: GroES binds to one end of the GroEL cylinder, which accommodates the protein substrate within its central cavity. EMBO J. 11:4757–4765. - PMC - PubMed
    1. Mogk, A., T. Tomoyasu, P. Goloubinoff, S. Rüdiger, D. Röder, H. Langen, and B. Bukau. 1999. Identification of thermolabile E. coli proteins: prevention and reversion of aggregation by DnaK and ClpB. EMBO J. 18:6934–6949. - PMC - PubMed
    1. Tomoyasu, T., A. Mogk, H. Langen, P. Goloubinoff, and B. Bukau. 2001. Genetic dissection of the roles of chaperones and proteases in protein folding and degradation in the Escherichia cytosol. Mol. Microbiol. 40:397–413. - PubMed
    1. Schröder, H., T. Langer, F. U. Hartl, and B. Bukau. 1993. DnaK, DnaJ and GrpE form a cellular chaperone machinery capable of repairing heat-induced protein damage. EMBO J. 12:4137–4144. - PMC - PubMed

Publication types

MeSH terms

LinkOut - more resources