. 2006 Jun;141(2):412-22.
doi: 10.1104/pp.106.081208. Epub 2006 Apr 28.

Combined transcript and metabolite profiling of Arabidopsis leaves reveals fundamental effects of the thiol-disulfide status on plant metabolism

Affiliations

Combined transcript and metabolite profiling of Arabidopsis leaves reveals fundamental effects of the thiol-disulfide status on plant metabolism

Anna Kolbe et al. Plant Physiol. 2006 Jun.

Abstract

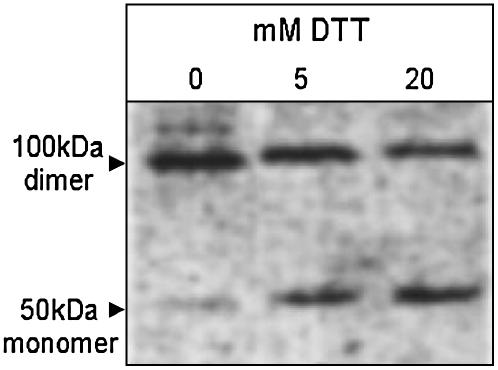
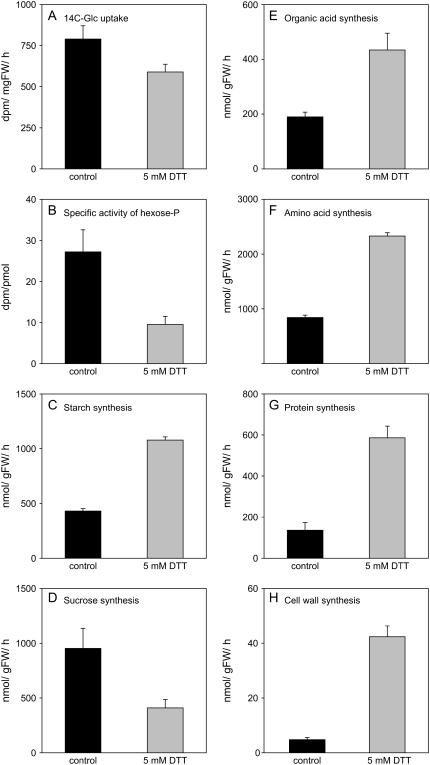
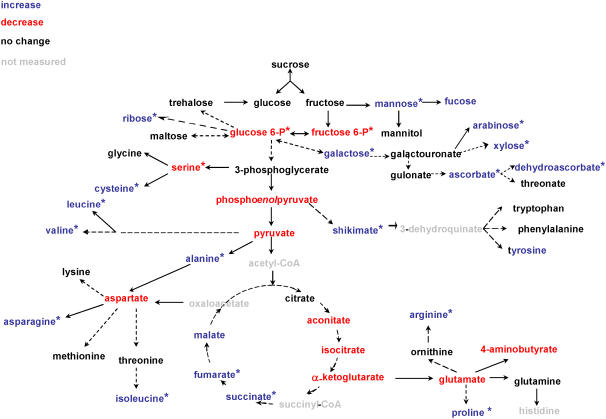
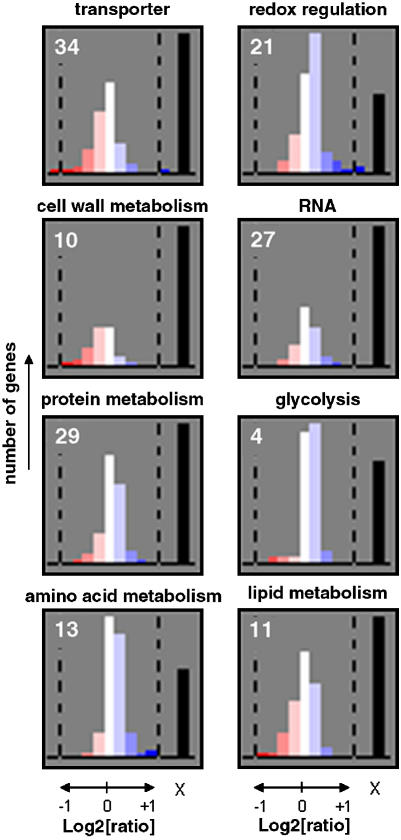
In this study, we used gas chromatography-mass spectrometry analysis in combination with flux analysis and the Affymetrix ATH1 GeneChip to survey the metabolome and transcriptome of Arabidopsis (Arabidopsis thaliana) leaves in response to manipulation of the thiol-disulfide status. Feeding low concentrations of the sulfhydryl reagent dithiothreitol for 1 h at the end of the dark period led to posttranslational redox activation of ADP-glucose pyrophosphorylase and major alterations in leaf carbon partitioning, including an increased flux into major respiratory pathways, starch, cell wall, and amino acid synthesis, and a reduced flux to sucrose. This was accompanied by a decrease in the levels of hexose phosphates, while metabolites in the second half of the tricarboxylic acid cycle and various amino acids increased, indicating a stimulation of anaplerotic fluxes reliant on alpha-ketoglutarate. There was also an increase in shikimate as a precursor of secondary plant products and marked changes in the levels of the minor sugars involved in ascorbate synthesis and cell wall metabolism. Transcript profiling revealed a relatively small number of changes in the levels of transcripts coding for components of redox regulation, transport processes, and cell wall, protein, and amino acid metabolism, while there were no major alterations in transcript levels coding for enzymes involved in central metabolic pathways. These results provide a global picture of the effect of redox and reveal the utility of transcript and metabolite profiling as systemic strategies to uncover the occurrence of redox modulation in vivo.


Figures

Figure 1.
Figure 1.
DTT feeding leads to posttranslational redox activation of AGPase in leaves. Leaves of Arabidopsis plants were harvested at the end of the night to prepare discs that were immediately incubated on 0, 5, or 20 mm DTT for 1 h in the dark. Discs were then quickly rinsed in buffer to remove external DTT before freezing in liquid nitrogen to analyze monomerization of the small subunit of AGPase (AGPB) using nonreductive SDS gels. Under these conditions oxidized AGPB runs as a 100 kD dimer while reduced AGPB runs as a 50 kD monomer.
Figure 2.
Figure 2.
Changes in metabolic fluxes after incubation of Arabidopsis leaf discs in 5 mm DTT. Incubations were performed exactly as described in Figure 1 with the exception that high specific activity 14C-Glc was included in the incubation medium. After 1 h, discs were sampled and frozen in liquid nitrogen to analyze uptake and metabolism of the labeled Glc and the specific activity of the internal hexose-phosphate pool. The specific activity of the hexose-phosphate pool was used to calculate absolute fluxes in nmol gFW−1 h−1. A, Total uptake of label. B, Specific activity of the hexose-phosphate pool. C, Starch synthesis. D, Suc synthesis. E, Organic acid synthesis. F, Amino acid synthesis. G, Protein synthesis. H, Cell wall synthesis. Results are the mean ± se (n = 5).
Figure 3.
Figure 3.
Changes in metabolite profiles after incubation of Arabidopsis leaf discs in 5 mm DTT. Incubations were performed exactly as described in Figure 1 before material was frozen in liquid nitrogen for metabolite analysis. Changes in metabolite levels were calculated as the ratio between DTT and buffer incubated samples and are listed in Supplemental Table I. To visualize the changes, increases or decreases larger than 10% were indicated with blue or red letters, respectively, within a metabolic scheme. Changes that are significantly different from the control (P < 0.05 using the Student's t test of Microsoft Excel) are indicated with an asterisk. Results are the mean ± se (n = 5).
Figure 4.
Figure 4.
Frequency distribution of DTT induced changes in transcript levels of genes categorized in functional bins that divert significantly from the mean change in expression of the genes from all other bins (see also Table I). Color codes of the bars relate to the level of expression (log2[ratio]) as indicated in the legend (blue, increased expression; red, decreased expression). The numbers refer to the functional bins as listed in Table I and defined by the MapMan software. The bar indicated with X indicates the number of genes within the category that were not expressed. Incubation of leaf discs with 5 mm DTT was performed exactly as described in Figure 1.

Similar articles

Cited by

References

    1. Ashton AR, Burnell JN, Furbank RT, Jenkins CD, Hatch MD (1990) Enzymes of C4 photosynthesis. In PM Dey, JB Harborne, eds, Methods in Plant Biochemistry, Vol 3. Academic Press, San Diego, pp 39–72
    1. Baier M, Dietz KJ (2005) Chloroplasts as source and target of cellular redox regulation: a discussion on chloroplast redox signals in the context of plant physiology. J Exp Bot 56: 1449–1462 - PubMed
    1. Ball L, Accotto GP, Bechthold U, Creissen G, Funck D, Jimenez A, Kular B, Leyland N, Mejia-Carranza J, Reynolds H, et al (2004) Evidence for a direct link between glutathione biosynthesis and stress defense gene expression in Arabidopsis. Plant Cell 16: 2448–2462 - PMC - PubMed
    1. Balmer Y, Koller A, del Val G, Manieri W, Schürmann P, Buchanan BB (2003) Proteomics gives insight into the regulatory function of chloroplast thioredoxins. Proc Natl Acad Sci USA 101: 2642–2647 - PMC - PubMed
    1. Balmer Y, Vensel WH, Tanaka CK, Hurkman WJ, Gelhaye E, Rouhier N, Jaquot J-P, Manieri W, Schürmann P, Droux M, et al (2004) Thioredoxin links redox to the regulation of fundamental processes of plant mitochondria. Proc Natl Acad Sci USA 101: 2642–2647 - PMC - PubMed

Publication types

MeSH terms