. 2007 Mar;17(3):702-12.
doi: 10.1093/cercor/bhk021. Epub 2006 Apr 28.

Quantitative analysis and subcellular distribution of mRNA and protein expression of the hyperpolarization-activated cyclic nucleotide-gated channels throughout development in rat hippocampus

Affiliations

Quantitative analysis and subcellular distribution of mRNA and protein expression of the hyperpolarization-activated cyclic nucleotide-gated channels throughout development in rat hippocampus

Amy L Brewster et al. Cereb Cortex. 2007 Mar.

Abstract

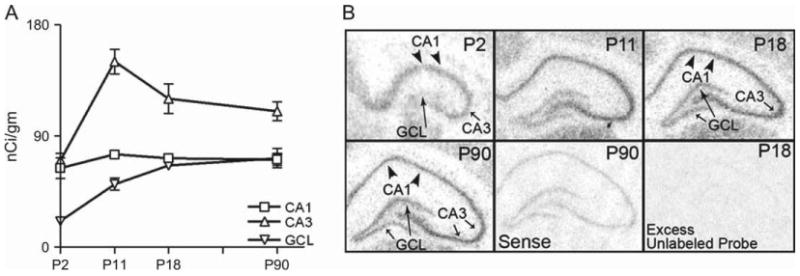
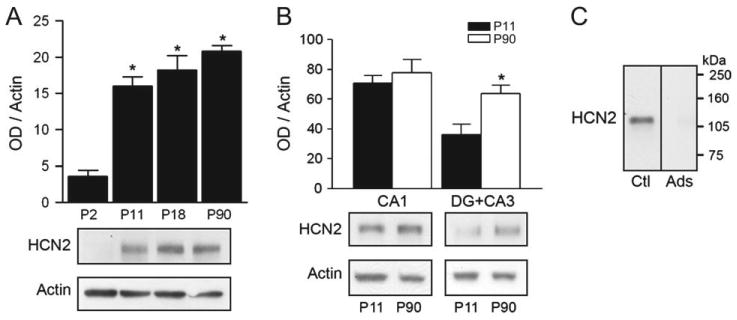
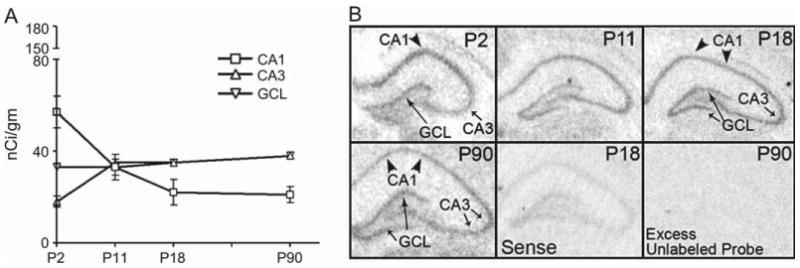
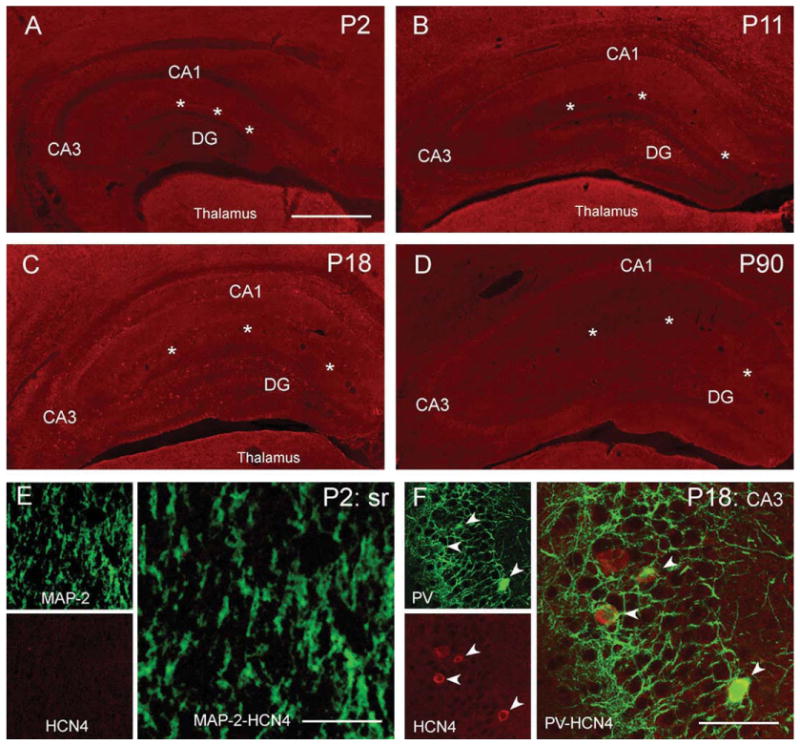
The properties of the hyperpolarization-activated current (I(h)) and its roles in hippocampal network function evolve radically during development. Because I(h) is conducted by the hyperpolarization-activated cyclic nucleotide-gated (HCN) cation channels, we tested the hypothesis that understanding the quantitative developmental profiles of HCN1, HCN2, and HCN4 expression, and the isoform- and age-specific progression of their subcellular distribution, should shed light on the established modifications of the properties of I(h) throughout development. Combined quantitative in situ hybridization, regional western blots, and high-resolution, dual-label immunocytochemistry revealed striking and novel information about the expression and distribution of the HCN channel isoforms in the developing hippocampal formation. In cornus ammon 1 (CA) pyramidal cell layer, a robust increase of HCN1 mRNA and protein expression occurred with age, with reciprocal reduction of HCN4 and relatively stable HCN2 levels. These distinct expression patterns raised the contribution of HCN1 to the total HCN channel pool from 33% to 65% consonant with acceleration and reduced cyclic adenosine mono phosphate (cAMP) sensitivity of I(h) in this region with age. In CA3, strong expression of HCN1 already neonatally supports the recently established role of this conductance in neonatal, age-specific, hippocampal oscillations (giant depolarizing potentials). Notably, HCN1 channels were present and probably transported to dendritic compartments already on postnatal day (P) 2, whereas HCN2 channel protein was not evident in dendrites for the first 2 weeks of life. HCN2 mRNA and protein expression remained fairly constant subsequent to the first week of life in all hippocampal subfields examined, whereas HCN4 mRNA and protein expression declined after maximal neonatal expression, so that the contribution of this isoform to the total HCN channel pool dropped from 43% (CA1) and 34% (CA3) on P11 to 8% (CA1) and 19% (CA3) on P90. Interneuronal expression of all HCN channel isoforms in stratum pyramidale was robust in parvalbumin-but not in cholecystokinin-expressing populations and with a subunit-specific subcellular distribution. Taken together, these data suggest that early in life, HCN4 may contribute significantly to the functions of I(h) in specific hippocampal regions. In addition, these evolving, differential quantitative, and subcellular expression patterns of the HCN channel isoforms support age-specific properties and functions of I(h) within the developing hippocampal formation.


Conflict of interest statement

Conflict of interest: None declared.

Figures

Figure 1
Figure 1
Quantitative ISH analyses of HCN1 mRNA expression in developing hippocampus. (A) Expression increases progressively with age in pyramidal cell layers of CA1 and CA3 and in DG granule cell layer (GCL). This increase is particularly pronounced in CA1 (P2–P90: ∼250%). (B) Representative autoradiographs showing hippocampal HCN1 mRNA signal on P2, P11, P18, and P90 and the results of control ISH experiments using sense probe or excess (100×) unlabeled antisense probe in addition to labeled probe.
Figure 2
Figure 2
Quantitative western blot analyses of HCN1 protein expression in developing hippocampus. (A) Top: In whole hippocampus, HCN1 protein levels increase steadily between P2 and P90. Bottom: Representative western blot. Optical density (OD) of HCN1-immunoreactive bands was normalized to that of actin for each lane (*denotes significance when compared with P2, †denotes significance when compared with P90; t-test: P < 0.05). (B) Top: Analysis of regional HCN1 protein expression in isolated CA1 or DG + CA3 demonstrates that protein levels increase proportionally with mRNA levels in these regions (CA1: ∼70%, DG + CA3: ∼111%, compare with Fig. 1B). Bottom: Representative western blots illustrate significantly higher HCN1 protein levels in both CA1 and DG + CA3 in a P90 compared with a P11 rat (*denotes significance between age groups; t-test: P < 0.05). (C) Top: Schematic illustration of dissection procedure for regional analyses. Bottom: Immunoreactive HCN1 bands (Ctl) have an apparent molecular weight of ∼120 kDa. Preadsorption (Ads) with antigen or excluding HCN1 antisera (-P) in the presence of the secondary antibody abolishes immunoreactivity.
Figure 3
Figure 3
Subcellular localization of HCN1 channels in developing hippocampus. (A, B) Low-magnification photographs demonstrate that HCN1 channels are localized in the dendritic field of CA1 pyramidal cells as early as P2 (A) found in both stratum radiatum as well as in stratum lacunosum-moleculare (slm,B). On P11, but not later, HCN1 signal is also observed in the medial molecular layer (mml) of DG, where the signal is likely within the axons of the perforant path (Bender, Kretz, and others 2005). (C, D) Dual labeling of HCN1 (red) and the dendritic marker MAP-2 (green) on P2 (C) and P11 (D) reveals that most HCN1 coresides with the dendritic marker. In contrast, dual labeling of HCN1 with presynaptic markers of afferents to the CA1 dendrites failed to demonstrate a presynaptic location of HCN1 in VGLUT1-containing terminals, whereas a modest colocalization of the HCN1 immunoreactivity with GABAergic terminals (GAD65) was found on P11 but not on P2 (D). (E) By P18, the HCN1 distribution pattern strongly resembles the mature pattern (F) characterized by a robust expression of HCN1 channels in the distal dendritic field of CA1 (slm) and by pronounced HCN1 signal in CA3 (arrows in B,E,F). (G, H) HCN1 signal in the pyramidal cell layer (particularly in CA3) is mainly attributable to expression of the channels in axons of basket cells. Dual labeling of HCN1 (red) and PV (green in G) or CCK (green in H) reveals that HCN1 frequently localizes to axonal terminals of PV-expressing basket cells (G) but never to terminals that contain CCK (H). sp, stratum pyramidale; so, stratum oriens; asterisks demarcate the hippocampal fissure. Confocal microscopy virtual slice thicknesses:(A,B,E,F) = 15 μm (surface scanning), (C, D) (MAP-2-HCN1) and (G, H) = 1 μm. (D) GAD65 and VGLUT dual labeling with HCN1 = 0.5 μm. Scale bar:(A,B,E,F) = 900 μm; (C) = 27 μm (left panels), 13.5 μm (right panel); (D) = 27 μm (left and right panels), 13.5 μm (middle panel); (G, H) = 40 μm (left panels), 20 μm (right panel).
Figure 4
Figure 4
Quantitative ISH analyses of HCN2 mRNA expression in developing hippocampus. (A) Expression levels of HCN2 mRNA evolve differentially in hippocampal regions: Expression remains relatively constant in CA1 pyramidal cell layer, whereas it increases with age in CA3 and DG principal cell layers. In CA3, HCN2 mRNA expression increases during the second postnatal week reaching mature levels by P11. (B) Representative autoradiographs show hippocampal HCN2 mRNA signal on P2, P11, P18, and P90 and the results of control ISH experiments using sense probe or excess (100×) unlabeled antisense probe in addition to labeled probe.
Figure 5
Figure 5
Quantitative western blot analyses of HCN2 protein expression in developing hippocampus. (A) Top: In whole hippocampus, HCN2 protein levels are relatively low on P2, increase between P2 and P11, but not thereafter. Bottom: Representative western blot. Optical density (OD) of HCN2-immunoreactive bands was normalized to that of actin for each lane (*denotes significance when compared with P2, P < 0.05). (B) Top: Regional analyses reveal that HCN2 protein and mRNA expression (see Fig. 4A) are comparable in CA1. However, in DG + CA3, HCN2 protein levels are significantly higher on P90 compared with P11, in contrast to mRNA levels (*denotes significance between groups; t-test: P < 0.05). Bottom: Representative western blots. (C) Immunoreactive-HCN2 bands (Ctl) have an apparent molecular weight of ∼115 kDa. Preadsorption (Ads) with antigen abolishes immunoreactivity. Note that because both HCN1 and HCN2 are detected using the same secondary antibody (anti-rabbit IgG), a control experiment omitting the primary antibody is provided for HCN1 only (Fig. 2C).
Figure 6
Figure 6
Subcellular localization of HCN2 channels in developing hippocampus. (A–D) Low-magnification photographs demonstrate distribution of HCN2 channels on P2 (A), P11 (B), P18 (C), and P90 (D). In contrast to HCN1, HCN2 somata can easily be discerned in the P11 CA1 pyramidal cell layer, in both PV+ interneurons and PV–, presumed pyramidal, neurons. Localization of HCN2 channels in dendritic field of CA1 is apparent later in hippocampal maturation, as confirmed by high-resolution dual labeling: (E, F) Dual labeling of HCN2 (red) and MAP-2 (green) reveals overlapping expression in CA1 stratum lacunosum-moleculare (slm) on P90 (F), but not on P11 (E), suggesting that, compared with HCN1 (Fig. 3), dendritic trafficking of HCN2 channels commences at a later stage of CA1 pyramidal cell differentiation. Note that the pattern of HCN2 immunoreactivity is more punctate than that of HCN1, but this does not delineate presynaptic location: HCN2 fails to colocalize to GABAergic (GAD65) or glutamatergic (VGLUT1) afferents to the dendrites in slm. (G, H) Similar to HCN1, HCN2 signal over the pyramidal cell layer in CA3 (arrows in B,C, and D) is attributable to expression of HCN2 channels in axons and terminals as well as somata of basket cells. PV+ (G, arrowheads) but never CCK+ basket cells (H) colocalize HCN2. sr, stratum radiatum; asterisks demarcate the hippocampal fissure. Confocal microscope virtual slice thicknesses: (A–D) = 15 μm, (E, F) (MAP-2-HCN2) = 1 μm. (F) (GAD65 and VGLUT) = 0.5 μm. Scale bar: (A–D) = 900 μm; (E) = 27 μm (left panels), 13.5 μm (right panel); (F) = 27 μm (left and right panels), 13.5 μm (middle panel); (G, H) = 120 μm (left panels), 60 μm (right panel).
Figure 7
Figure 7
Quantitative ISH analyses of HCN4 mRNA expression in developing hippocampus. (A) HCN4 mRNA is robustly expressed in neonatal CA1 pyramidal cell layer, where it decreases progressively with age (P2–P90: ~65%). In contrast, HCN4 mRNA expression is low in CA3 pyramidal cell layer and DG granule cell layer (GCL) on P2. With maturation expression increases 2-fold in CA3, whereas it remains constant in GCL. Note that HCN4 mRNA levels are lower than those of HCN1 (Fig. 1) and HCN2 (Fig. 4) and are shown on an expanded scale. (B) Representative autoradiographs show hippocampal HCN4 mRNA signal on P2, P11, P18, and P90 and the results of control ISH experiments using sense probe or excess (100×) unlabeled antisense probe in addition to labeled probe.
Figure 8
Figure 8
Quantitative western blot analyses of HCN4 protein expression in developing hippocampus. (A) Top: Analysis of HCN4 protein levels in whole hippocampus reveals a progressive decrease of HCN4 protein expression between P2 and P90 (*denotes significance when compared with P2 and P11, †denotes significance when compared with P18; P < 0.05). Bottom: Representative western blot. Optical density (OD) of HCN4-immunoreactive bands was normalized to that of actin for each lane. (B) Top: Progression of HCN4 protein expression in isolated CA1 or DG + CA3 reflects the developmental profiles of the corresponding mRNA levels in these regions (compare with Fig. 7A). In CA1, HCN4 protein decreases ∼80% (corresponding mRNA decrease: 57%), whereas protein levels remain unchanged in DG + CA3 (*denotes significance between groups; t-test: P < 0.05). Bottom: Representative western blots illustrate significantly higher HCN4 protein levels in CA1 at P11. (C) Immunoreactive-HCN4 bands have an apparent molecular weight of ∼160 kDa (Notomi and Shigemoto 2004). Control experiments excluding the HCN4 antisera (-P) eliminate the immunoreactive bands.
Figure 9
Figure 9
Subcellular localization of HCN4 channels in developing hippocampus. (A–D) Low-magnification photographs show relatively low levels of HCN4 immunoreactivity in hippocampus on P2 (A), P11 (B), P18 (C), whereas HCN4 signal was poorly detectable on P90 (D). On P2, HCN4 signal was distributed over the pyramidal cell layer and weakly apparent in the dendritic fields of CA1 (A); however, dual labeling with MAP-2 did not provide evidence for a dendritic localization of these channels (E). HCN4 expression in interneurons was clearly visible on P18 (C). HCN4-immunoreactive interneurons were mainly associated with the pyramidal cell layer (F, arrowheads) and, similar to HCN1 and HCN2, coexpressed PV (F) but not CCK. In contrast to the situation with HCN1 and HCN2, HCN4 protein expression was found primarily in somata of PV-positive basket cells (F, arrowheads) and rarely in axonal terminals. slm, stratum lacunosum-moleculare; sr, stratum radiatum; asterisks demarcate hippocampal fissure. Virtual slice thickness: (A–D) = 15 μm; (E, F) = 1 μm. Scale bar: (A–D) = 900 μm; (E) = 27 μm (left panels), 13.5 μm (right panel); (F) = 120 μm (left panels), 60 μm (right panel).

References

    1. Agmon A, Wells JE. The role of the hyperpolarization-activated cationic current I(h) in the timing of interictal bursts in the neonatal hippocampus. J Neurosci. 2003;23:3658–3668. - PMC - PubMed
    1. Beaumont V, Zucker RS. Enhancement of synaptic transmission by cyclic AMP modulation of presynaptic Ih channels. Nat Neurosci. 2000;3:133–141. - PubMed
    1. Ben-Ari Y. Developing networks play a similar melody. Trends Neurosci. 2001;24:353–360. - PubMed
    1. Ben-Ari Y. Excitatory actions of gaba during development: the nature of the nurture. Nat Rev Neurosci. 2002;3:728–739. - PubMed
    1. Bender RA, Brewster AL, Santoro B, Ludwig A, Hofmann F, Biel M, Baram TZ. Differential and age-dependent expression of hyperpolarization-activated, cyclic nucleotide-gated cation channel isoforms 1-4 suggests evolving roles in the developing rat hippocampus. Neuroscience. 2001;106:689–698. - PMC - PubMed

Publication types

MeSH terms