

Integrating data on DNA copy number with gene expression levels and drug sensitivities in the NCI-60 cell line panel
- PMID: 16648555
- PMCID: PMC2733874
- DOI: 10.1158/1535-7163.MCT-05-0155
Integrating data on DNA copy number with gene expression levels and drug sensitivities in the NCI-60 cell line panel
Abstract
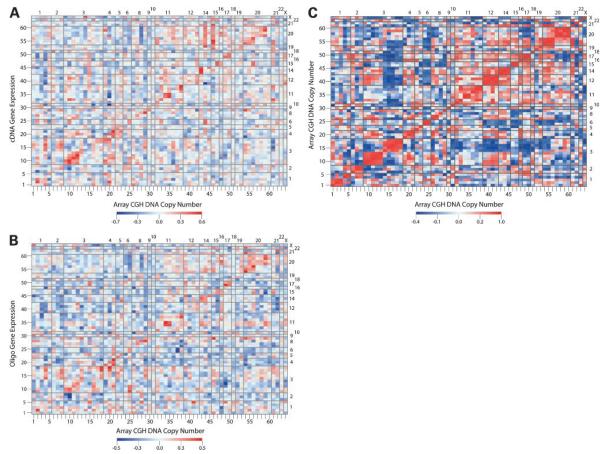
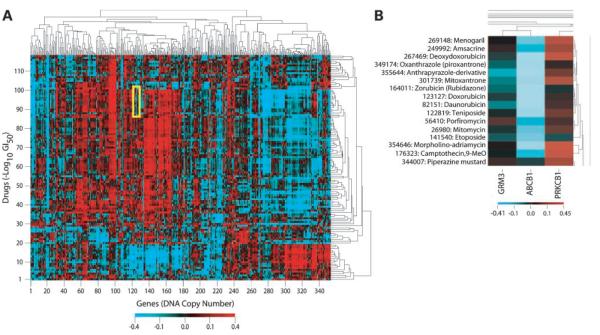
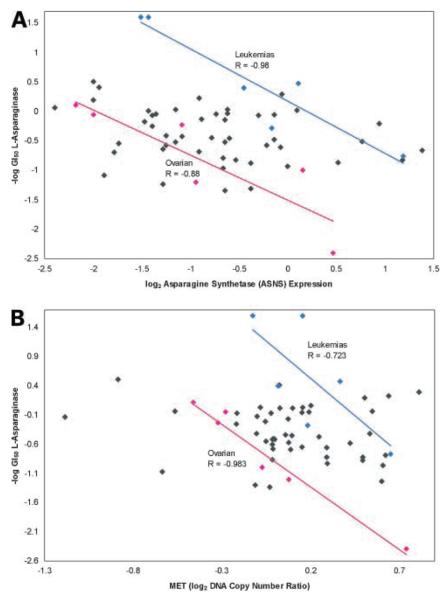
Chromosome rearrangement, a hallmark of cancer, has profound effects on carcinogenesis and tumor phenotype. We used a panel of 60 human cancer cell lines (the NCI-60) as a model system to identify relationships among DNA copy number, mRNA expression level, and drug sensitivity. For each of 64 cancer-relevant genes, we calculated all 4,096 possible Pearson's correlation coefficients relating DNA copy number (assessed by comparative genomic hybridization using bacterial artificial chromosome microarrays) and mRNA expression level (determined using both cDNA and Affymetrix oligonucleotide microarrays). The analysis identified an association of ERBB2 overexpression with 3p copy number, a finding supported by data from human tumors and a mouse model of ERBB2-induced carcinogenesis. When we examined the correlation between DNA copy number for all 353 unique loci on the bacterial artificial chromosome microarray and drug sensitivity for 118 drugs with putatively known mechanisms of action, we found a striking negative correlation (-0.983; 95% bootstrap confidence interval, -0.999 to -0.899) between activity of the enzyme drug L-asparaginase and DNA copy number of genes near asparagine synthetase in the ovarian cancer cells. Previous analysis of drug sensitivity and mRNA expression had suggested an inverse relationship between mRNA levels of asparagine synthetase and L-asparaginase sensitivity in the NCI-60. The concordance of pharmacogenomic findings at the DNA and mRNA levels strongly suggests further study of L-asparaginase for possible treatment of a low-synthetase subset of clinical ovarian cancers. The DNA copy number database presented here will enable other investigators to explore DNA transcript-drug relationships in their own domains of research focus.
Figures
References
-
- Bieche I, Lidereau R. Loss of heterozygosity at 13q14 correlates with RB1 gene underexpression in human breast cancer. Mol Carcinog. 2000;29:151–8. - PubMed
-
- Bieche I, Laurendeau I, Tozlu S, et al. Quantitation of MYC gene expression in sporadic breast tumors with a real-time reverse transcription-PCR assay. Cancer Res. 1999;59:2759–65. - PubMed
-
- Smith CA, Pollice AA, Gu LP, et al. Correlations among p53, HER-2/neu, and ras overexpression and aneuploidy by multiparameter flow cytometry in human breast cancer: evidence for a common phenotypic evolutionary pattern in infiltrating ductal carcinomas. Clin Cancer Res. 2000;6:112–26. - PubMed
-
- Kristiansen G, Yu Y, Petersen S, et al. Overexpression of c-erbB2 protein correlates with disease-stage and chromosomal gain at the c-erbB2 locus in non-small cell lung cancer. Eur J Cancer. 2001;37:1089–95. - PubMed
-
- Benz CC, Scott GK, Santos GF, Smith HS. Expression of c-myc, c-Haras1, and c-erbB-2 proto-oncogenes in normal and malignant human breast epithelial cells. J Natl Cancer Inst. 1989;81:1704–9. - PubMed
Publication types
MeSH terms
Substances
Grants and funding
LinkOut - more resources
Full Text Sources
Other Literature Sources
Research Materials
Miscellaneous
