. 2005 Nov;26(4):97-122.

Biochemical markers of bone turnover: part I: biochemistry and variability

Affiliations

Biochemical markers of bone turnover: part I: biochemistry and variability

Markus J Seibel. Clin Biochem Rev. 2005 Nov.

Abstract

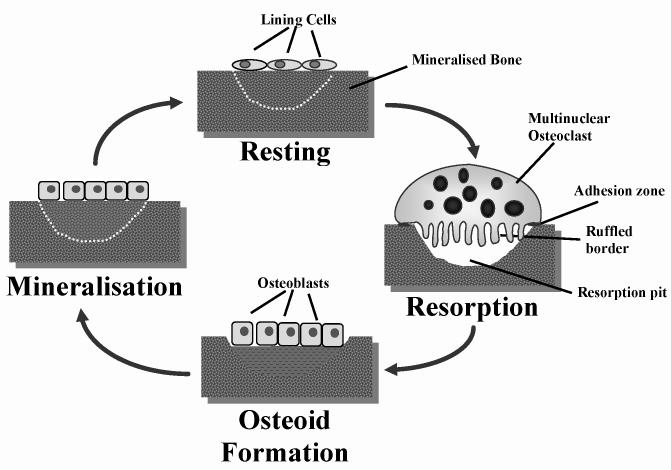
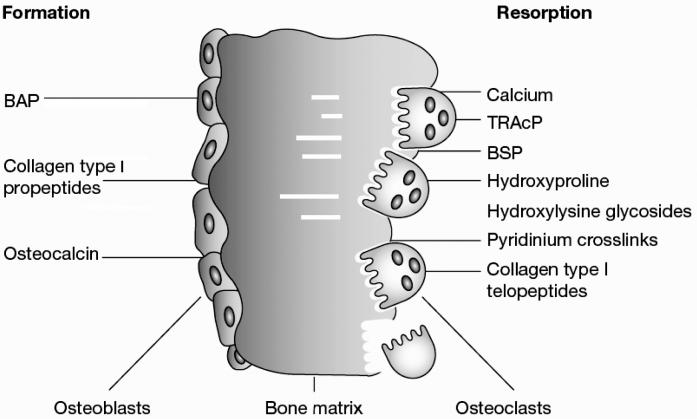
With the ageing population in most countries, disorders of bone and mineral metabolism are becoming increasingly relevant to every day clinical practice. Consequently, the interest in, and the need for effective measures to be used in the screening, diagnosis and follow-up of such pathologies has markedly grown. Together with clinical and imaging techniques, biochemical tests play an important role in the assessment and differential diagnosis of metabolic bone disease. In recent years, the isolation and characterisation of cellular and extracellular components of the skeletal matrix have resulted in the development of molecular markers that are considered to reflect either bone formation or bone resorption. These biochemical indices are non-invasive, comparatively inexpensive and, when applied and interpreted correctly, helpful tools in the diagnostic and therapeutic assessment of metabolic bone disease. Part I of this article provides an overview of the basic biochemistry of bone markers, and sources of non-specific variability. Part II (to be published in a subsequent issue of this journal) will review the current evidence regarding the clinical use of biochemical markers of bone remodelling in metabolic and metastatic bone disease.


Figures

Figure 1
Figure 1
The bone remodelling cycle. Under normal conditions, the resorption (osteoclast) phase takes approximately 10 days, which is then followed by a formation (osteoblast) phase that can last for up to 3 months.
Figure 2
Figure 2
Biochemical markers of bone remodelling.
Figure 3
Figure 3
Correlation between serum total and bone specific alkaline phosphatase. Patients with non-skeletal disease had chronic hepatic failure, chronic obstructive pulmonary disease, or chronic renal failure. Patients with skeletal disease had Paget’s disease of bone, primary or secondary hyperparathyroidism, or metastatic bone disease. TAP, total alkaline phosphatase; L-BAP, bone alkaline phosphatase measured by lectin precipitation assay; I-BAP, bone alkaline phosphatase measured by immunoradiometric assay (IRMA); E-BAP, bone alkaline phosphatase measured by enzyme linked immunosorbant assay (ELISA) Reproduced from, Woitge H, Seibel MJ, Ziegler R. Comparison of total and bone-specific alkaline phosphatase in patients with nonskeletal disorders or metabolic bone disease Clin Chem 1996;42:1796–1804 with permission of the publisher of Clinical Chemistry.
Figure 4
Figure 4
Schematic representation of the collagen type I molecule. The carboxy- and amino-terminal propeptides are cleaved by specific propeptidases and are partly released into the circulation. Figure courtesy of Dr Simon Robins, Aberdeen.
Figure 5
Figure 5
Molecular basis of currently used markers of type I collagen-related degradation. For more details, see text and Table 1. Figure courtesy Dr Simon Robins, Aberdeen.
Figure 6
Figure 6
Intra-assay precision profiles for three immunoassays measuring type I collagen degradation products in urine. A: Deoxypyridinoline (DPD), B: Aminoterminal crosslinked telopeptide (NTX), C: Carboxyterminal octapeptide (CTX) Reproduced from, Ju HS, Leung S, Brown B, et al. Comparison of analytical performance and biological variability of three bone resorption assays. Clin Chem 1997, 43:1570–6. With permission of Clinical Chemistry.
Figure 7
Figure 7
Dilution linearity profiles for three immunoassays measuring type I collagen degradation products in urine (n=4). A: Deoxypyridinoline (DPD), B: Aminoterminal crosslinked telopeptide (NTX), C: Carboxyterminal octapeptide (CTX). Reproduced from, Ju HS, Leung S, Brown B, et al. Comparison of analytical performance and biological variability of three bone resorption assays. Clin Chem 1997, 43:1570–6. With permission of Clinical Chemistry.
Figure 8
Figure 8
Diurnal variation. A–C: Comparison of three immunoassays measuring type I collagen degradation products in urine. A: Deoxypyridinoline (DPD), B: Aminoterminal crosslinked telopeptide (NTX), C: Carboxyterminal octapeptide (CTX). All values are creatinine-corrected. The thick line represents the mean, while thin lines are individual subjects. Reproduced from, Ju HS, Leung S, Brown B, et al. Comparison of analytical performance and biological variability of three bone resorption assays. Clin Chem 1997, 43:1570–76. With the permission of Clinical Chemistry.
Figure 9
Figure 9
Age-related changes in (A) bone specific alkaline phosphatase and (B) urinary collagen type I aminoterminal crosslinked telopeptide (NTX). Pre, premenopausal women; peri MP 1, early perimenopausal women; peri MP 2, late peri-menopausal women; post MP, postmenopausal women; M, menopause. Reproduced from Garnero, P, Sornay-Rendu, E, Chapuy, M-C, Delmas, PD. Increased bone turnover in late postmenopausal women is a major determinant of osteoporosis. J. Bone Miner Res. 1996, 11, 337–49. With the permission of the American Society for Bone and Mineral Research.
Figure 9
Figure 9
Age-related changes in (A) bone specific alkaline phosphatase and (B) urinary collagen type I aminoterminal crosslinked telopeptide (NTX). Pre, premenopausal women; peri MP 1, early perimenopausal women; peri MP 2, late peri-menopausal women; post MP, postmenopausal women; M, menopause. Reproduced from Garnero, P, Sornay-Rendu, E, Chapuy, M-C, Delmas, PD. Increased bone turnover in late postmenopausal women is a major determinant of osteoporosis. J. Bone Miner Res. 1996, 11, 337–49. With the permission of the American Society for Bone and Mineral Research.
Figure 10
Figure 10
Age-related changes of biochemical markers of bone formation and resorption in men. (A) Serum osteocalcin, (B) Serum bone-specific alkaline phosphatase, and (C) 24-h urinary excretion of deoxypyridinoline. Reproduced from, Szulc, P, Garnero, P, Munoz, F, Marchand, F, Delmas, PD. Cross-sectional evaluation of bone metabolism in men. J Bone Miner Res. 2001, 16, 1642–50 with permission of the American Society for Bone and Mineral Research.
Figure 8D
Figure 8D
Diurnal variation in serum CTX levels in six healthy male volunteers. On average, the peak value was 66% higher and the nadir was 60% lower than the calculated daily mean. Reproduced from, Wichers M, Schmidt E, Bidlingmaier F, Klingmüller D. Diurnal rhythm of Crosslaps in human serum. Clin Chem 1999, 45, 1858–60. With the permission of Clinical Chemistry.
Figure 11
Figure 11
Seasonal variability of serum bone specific alkaline phosphatase (S-BAP) and urinary deoxypyridinoline (U-DPD). Values are presented as the percent change from the annual mean (±SEM). The number and width of representative intervals of each bone marker were computed as Δ = (Dmax − Dmin)/(1 + 3.322 x Ig n), in which Δ is the interval width, Dmax is the end of the analysis period (December 31), Dmin is the beginning of the analysis period (January l), n is the number of data points, and l + 3.322 x Ig n gives the number of intervals. After computing mean values and weighing the number of data points in each interval, graphs were constructed using the least square curve fitting by means of a polynomial regression. Data points (mean values ± SEM) are placed on the median of the respective interval (i.e. for S-BAP in males, January 25 represents the median of the first interval ranging from January l to February 15). Differences in the number and width of representative intervals between parameters result from missing laboratory values or elimination of extreme values in some instances. Reproduced from, Woitge, H, Scheidt-Nave, C, Kissling, C, et al. Seasonal variation of biochemical indices of bone turnover: results of a population based study. J Clin Endocrinol Metab. 1998;83:68–75. With permission from The Endocrine Society.

References

    1. Lian JB and Stein GS. The cells of bone. In: Dynamics of bone and cartilage metabolism. Seibel MJ, Robins SP, Bilezikian JP (eds), Academic Press, San Diego; 1999, 165–86.
    1. Rizzoli R and Bonjour JP. Physiology of calcium and phosphate homeostasis. In: Dynamics of bone and cartilage metabolism. Seibel MJ, Robins SP, Bilezikian JP (eds), Academic Press, San Diego; 1999, 247–60.
    1. Stinson RA, Hamilton BA. Human liver plasma membranes contain an enzyme activity that removes membrane anchor from alkaline phosphatase and converts it to a plasma-like form. Clin Biochem. 1994;27:49–55. - PubMed
    1. Harris H. The human alkaline phosphatases: what we know and what we don’t know. Clin Chim Acta. 1990;186:133–50. - PubMed
    1. Crofton PM. Biochemistry of alkaline phosphatase isoenzymes. Crit Rev Clin Lab Sci. 1982;16:161–94. - PubMed

LinkOut - more resources