. 2006 May 9;22(10):4699-709.
doi: 10.1021/la053242r.

Exploring the interaction of ruthenium(II) polypyridyl complexes with DNA using single-molecule techniques

Affiliations

Exploring the interaction of ruthenium(II) polypyridyl complexes with DNA using single-molecule techniques

Aleksandra Mihailovic et al. Langmuir. .

Abstract

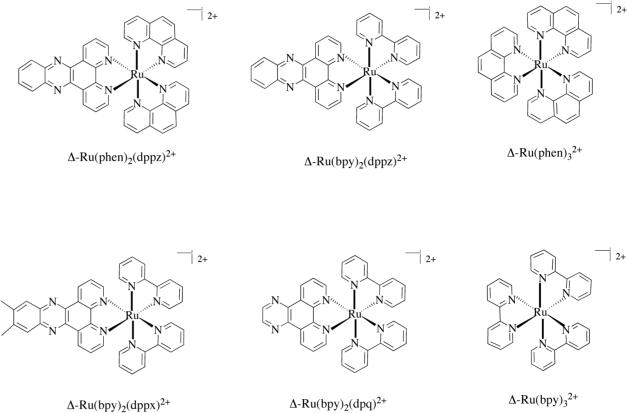
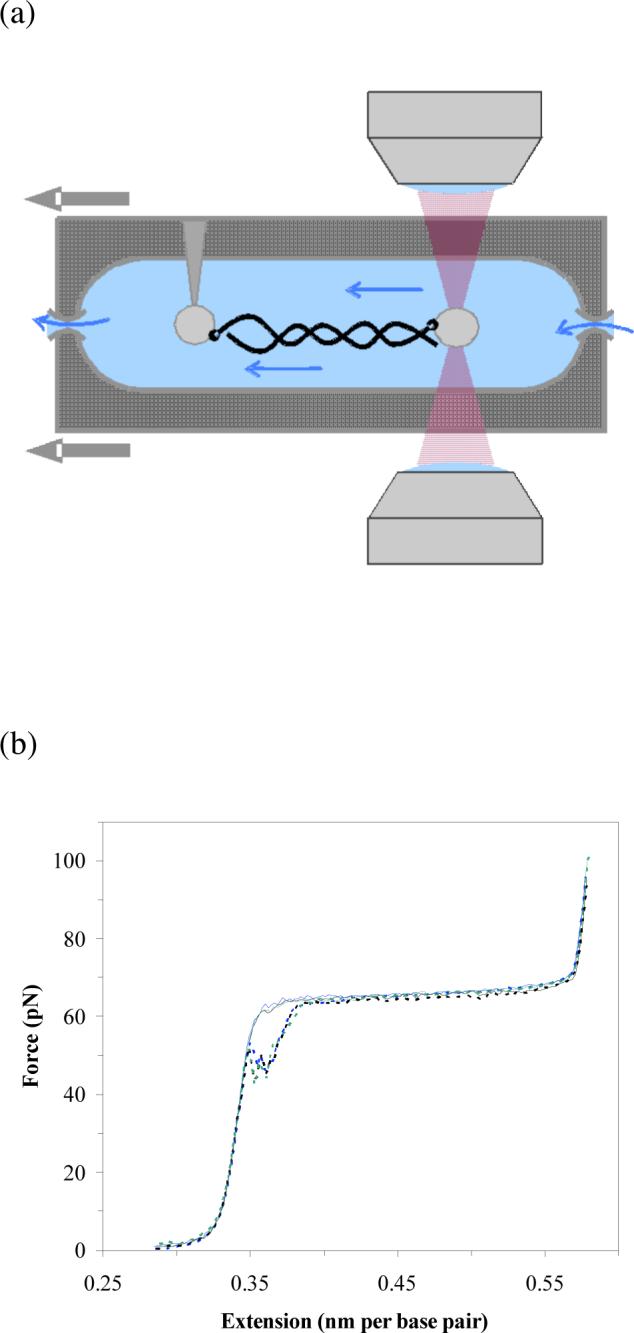
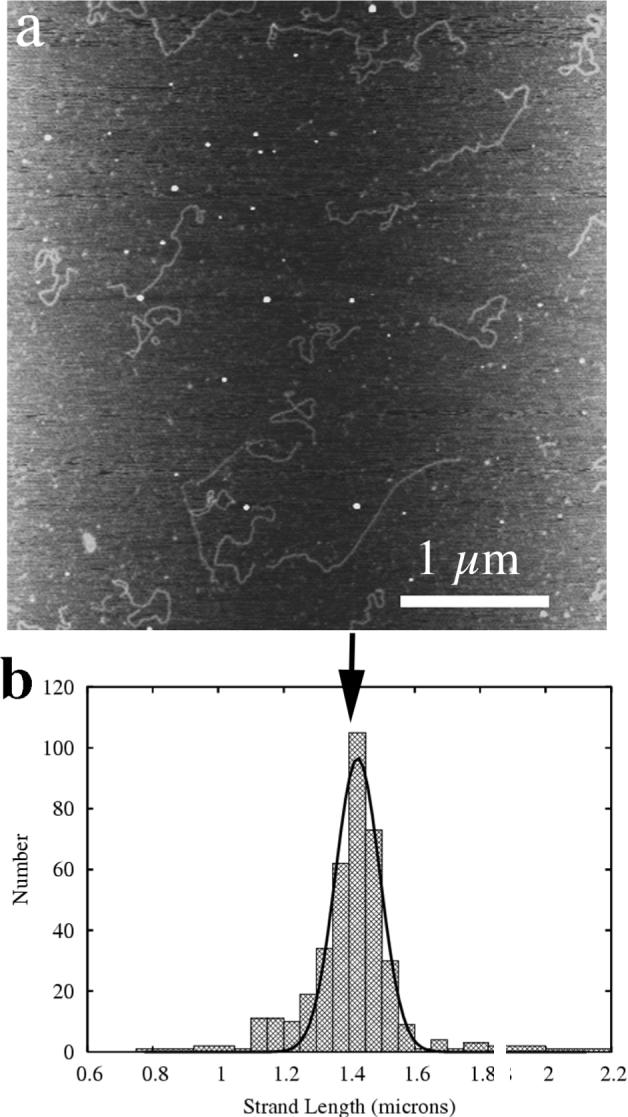
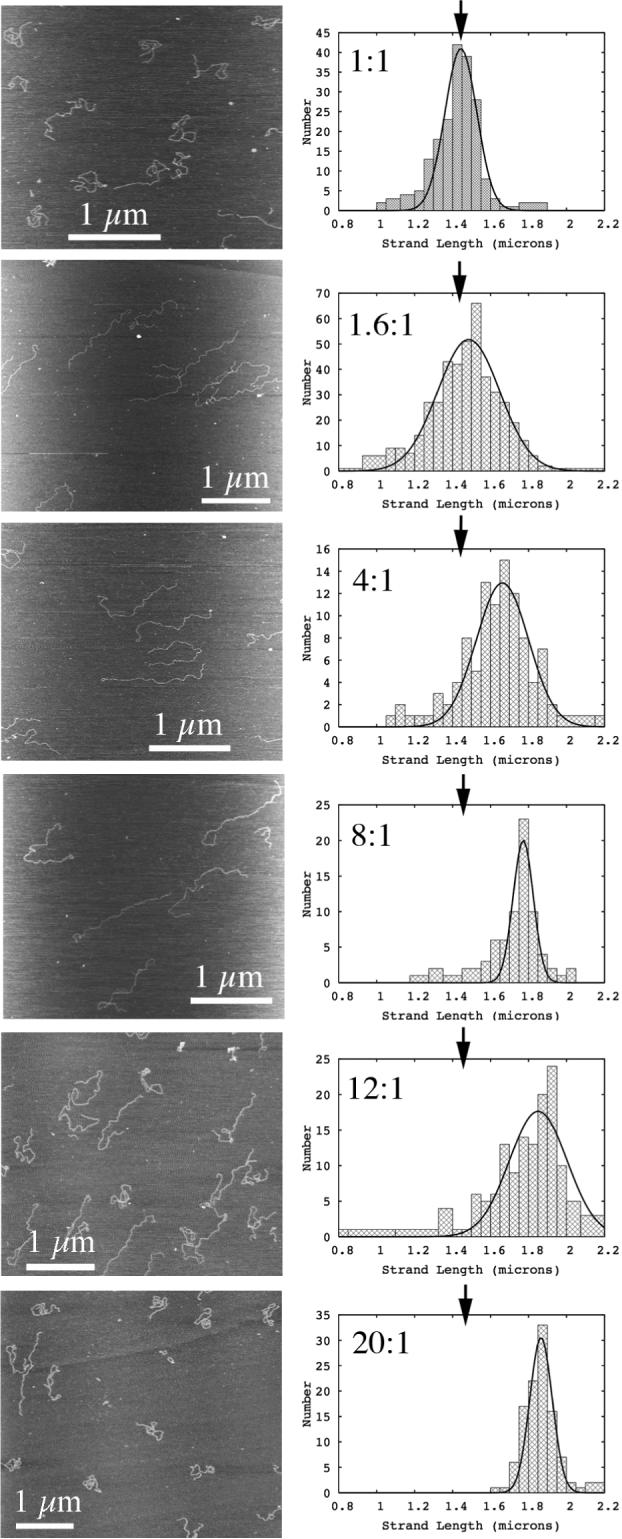
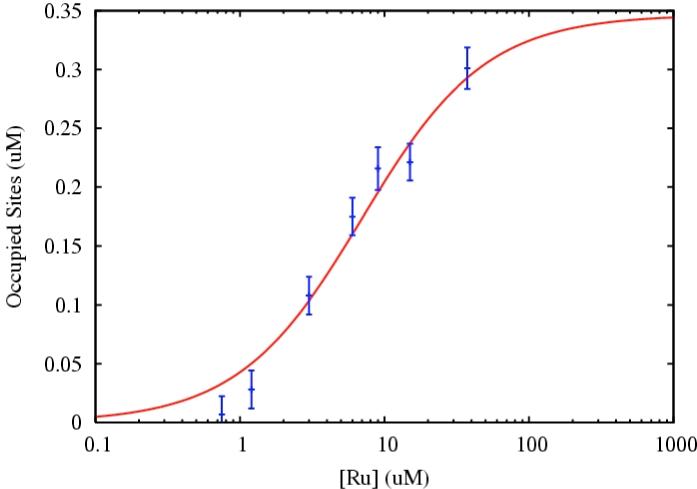
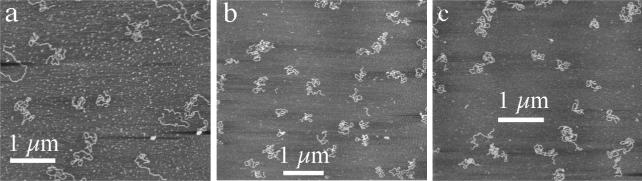
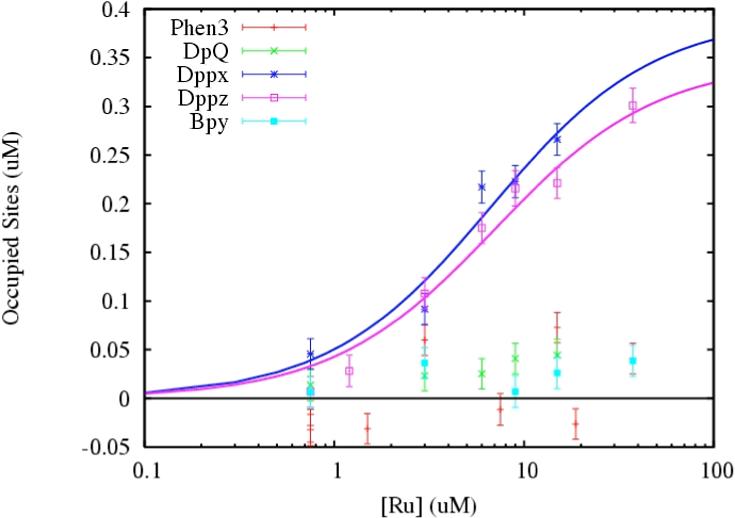
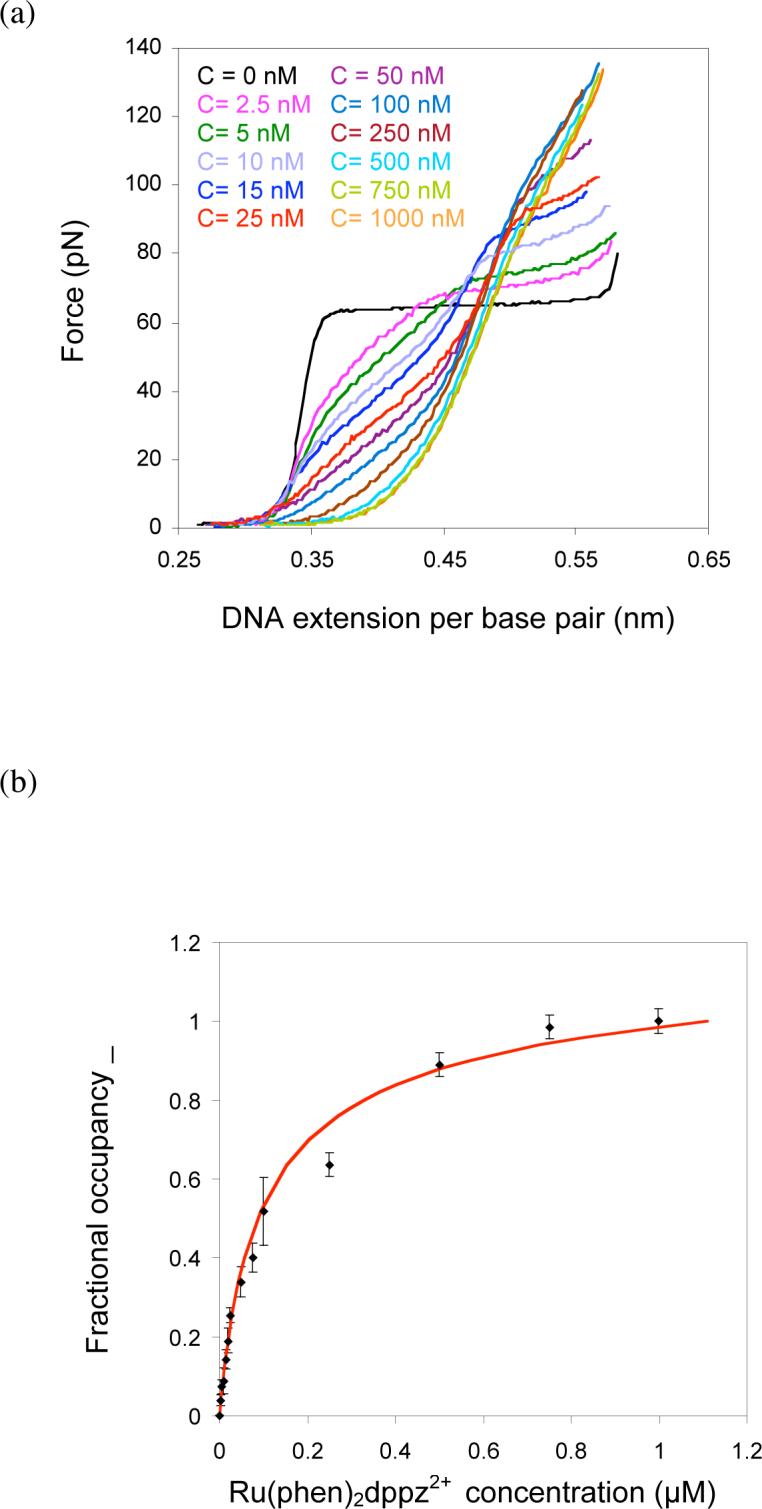
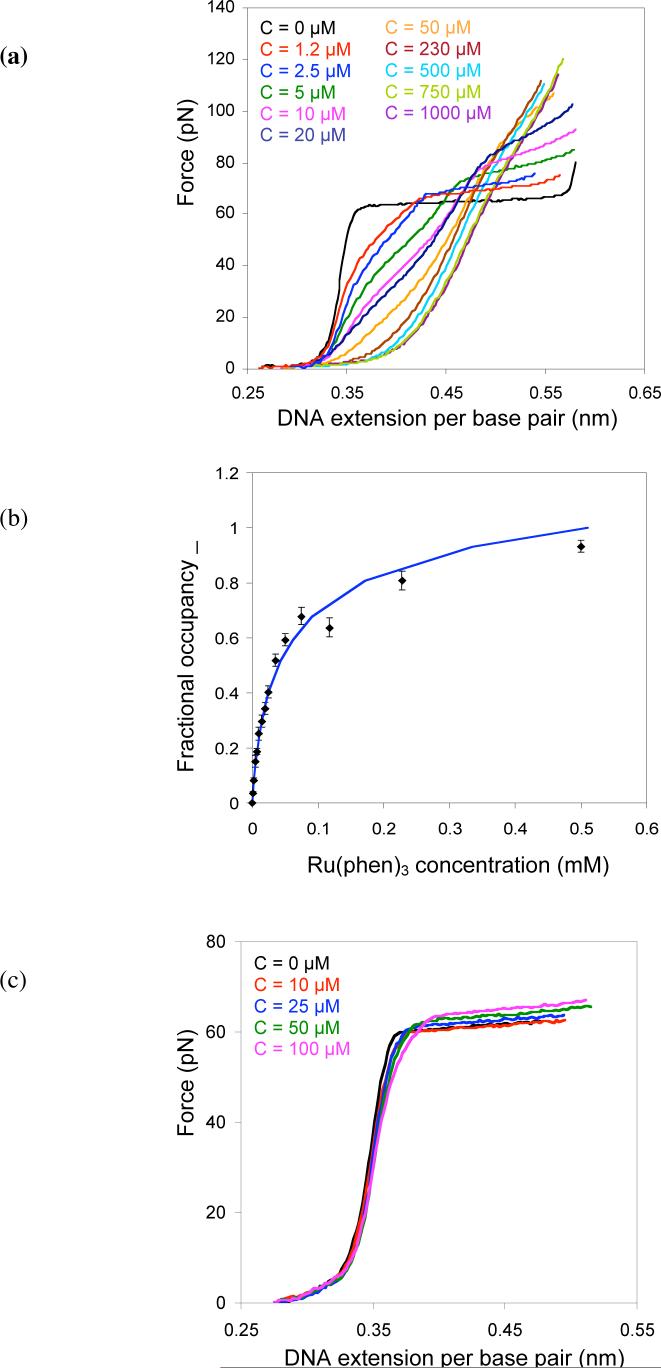
Here we explore DNA binding by a family of ruthenium(II) polypyridyl complexes using an atomic force microscope (AFM) and optical tweezers. We demonstrate using AFM that Ru(bpy)2dppz2+ intercalates into DNA (K(b) = 1.5 x 10(5) M(-1)), as does its close relative Ru(bpy)2dppx2+ (K(b) = 1.5 x 10(5) M(-1)). However, intercalation by Ru(phen)3(2+) and other Ru(II) complexes with K(b) values lower than that of Ru(bpy)2dppz2+ is difficult to determine using AFM because of competing aggregation and surface-binding phenomena. At the high Ru(II) concentrations required to evaluate intercalation, most of the DNA strands acquire a twisted, curled conformation that is impossible to measure accurately. The condensation of DNA on mica in the presence of polycations is well known, but it clearly precludes the accurate assessment by AFM of DNA intercalation by most Ru(II) complexes, though not by ethidium bromide and other monovalent intercalators. When stretching individual DNA molecules using optical tweezers, the same limitation on high metal concentration does not exist. Using optical tweezers, we show that Ru(phen)2dppz2+ intercalates avidly (K(b) = 3.2 x 10(6) M(-1)) whereas Ru(bpy)3(2+) does not intercalate, even at micromolar ruthenium concentrations. Ru(phen)3(2+) is shown to intercalate weakly (i.e., at micromolar concentrations (K(b) = 8.8 x 10(3) M(-1))). The distinct differences in DNA stretching behavior between Ru(phen)3(2+) and Ru(bpy)3(2+) clearly illustrate that intercalation can be distinguished from groove binding by pulling the DNA with optical tweezers. Our results demonstrate both the benefits and challenges of two single-molecule methods of exploring DNA binding and help to elucidate the mode of binding of Ru(phen)3(2+).


Figures

Figure 1
Figure 1. Structures of the ruthenium complexes used in this study
The shortened names under each structure will be used throughout this paper. Only the right-handed (Δ) enantiomers are shown here, though the racemic mixtures were used in these studies.
Figure 2
Figure 2. DNA stretching experiments
(a) Biotin labeled DNA (black) is extended between two streptavidin-coated beads (grey) held by a micropipette tip and an optical trap (red). Arrows indicate the direction that the solution flows through the flow cell. (b) Force extension (solid lines) and relaxation data (dotted lines) for DNA in 10 mM Hepes pH 7.5, 50 mM Na+.
Figure 3
Figure 3. Determining the length of DNA by AFM
(a) An atomic force microscope image showing several pieces of DNA on a cleaved mica substrate. All are 1461-base-pair, double-stranded restriction fragments derived from pBR322. (b) Histogram of the measured lengths of individual DNA molecules. The mean measured length of the DNA molecules is 1.43 ± 0.03 μm (black arrow); the calculated length of the DNA is 1.46 μm, based on a 0.34 nm base pair step.
Figure 4
Figure 4. DNA lengthening due to intercalative binding by Ru(bpy)2dppz2+
Characteristic AFM images and histograms of DNA length are shown for six ruthenium concentrations: (a) 750 nM Ru, or 1:1 Ru:base pairs (b) 1.2 μM Ru, or 1.6:1 Ru:base pairs (c) 3 μM, or 4:1 Ru:base pairs (d) 6 μM, or 8:1 Ru:base pairs (e) 9.0 μM or 12:1 Ru:base pairs (f) 15 μM, or 20:1 Ru:base pairs. The DNA concentration is 750 nM base pairs in all cases. The mean measured length of the DNA molecules alone is 1.43 ± 0.03 μm (black arrows).
Figure 5
Figure 5. Calculating Kb and n for intercalation by Ru(bpy)2dppz2+
(a) Concentration of occupied intercalation sites as a function of ruthenium concentration. Line represents best fit to the data, Kb = 1.5 ± 0.7 × 10⁵ M−1, n = 2.1 ± 0.4.
Figure 6
Figure 6. AFM images with high concentrations of ruthenium(II) complex
(a) 50:1 Ru(bpy)2(dppz)2+ to base pairs, or 37 μM (b) 50:1 Ru(phen)32+, or 37 μM (c) 50:1 Ru(bpy)32+, or 37 μM. Note that the DNA is generally curled up, which makes it difficult or impossible to measure most or all of the molecules. Those that can be measured sometimes appear shorter than DNA with less bound Ru(II). Also, the mica surface can be hydrophobic and the tip does not track across the surface well.
Figure 7
Figure 7. DNA Binding curves for five ruthenium octahedral complexes, as determined by AFM
The concentration of occupied base pairs is shown as a function of Ru(II) concentration for the five complexes studied here: Ru(bpy)2dppz2+, Ru(phen)32+, Ru(bpy)32+, Ru(bpy)2dppx2+, Ru(bpy)2dpq2+. Curves represent fits to the values shown in Table 1.
Figure 8
Figure 8. DNA pulling using optical tweezers in the presence of Ru(phen)2dppz2+
(a) DNA extension vs. force curves are shown for a range of concentrations of Ru(phen)2dppz2+. The black line is the force-extension curve for DNA alone. The Ru(phen)2dppz2+ reaches saturation around 750 nm. (b) A Binding titration curve is determined from the extension vs. force data. The fractional occupancy Θ is shown as a function of ruthenium concentration at 10 pN of force. The binding curve represents the best fit to the McGhee-von Hippel model (Eqn. 7) and the binding constant and neighbor exclusion number shown in Table 1.
Figure 9
Figure 9. DNA pulling using optical tweezers in the presence of Ru(phen)32+ or Ru(bpy)32+
(a) DNA extension vs. force curves are shown for a range of concentrations of Ru(phen)32+. The black line is the force-extension curve for DNA alone. The Ru(phen)32+ reaches saturation around 750 μm. (b) The fractional occupancy Θ is shown as a function of Ru(phen)32+ concentration at 20 pN of force. The binding curve represents the best fit to equation 7 and the binding constant and neighbor exclusion number shown in Table 1. (c) DNA extension vs. force curves are shown for a range of concentrations of Ru(bpy)32+.

Similar articles

Cited by

References

    1. Kumar CV, Barton JK, Turro NJ. J. Am. Chem. Soc. 1985;107:5518–5523.
    1. Barton JK, Goldberg JM, Kumar CV, Turro NJ. J. Am. Chem. Soc. 1986;108:2081–2088.
    1. Pyle AM, Rehmann JP, Meshoyrer R, Kumar CV, Turro NJ, Barton JK. J. Am. Chem. Soc. 1989;111:3051–3058.
    1. Hiort C, Nordén B, Rodger A. J. Am. Chem. Soc. 1990;112:1971–1982.
    1. Lincoln P, Nordén B. J. Phys. Chem. B. 1998;102:9583–9594.

Publication types