

Corneal pachymetry mapping with high-speed optical coherence tomography
- PMID: 16650675
- PMCID: PMC1474520
- DOI: 10.1016/j.ophtha.2006.01.048
Corneal pachymetry mapping with high-speed optical coherence tomography
Abstract
Objective: To map corneal thickness before and after LASIK with optical coherence tomography (OCT).
Design: Cross-sectional observational study.
Participants: Forty-two eyes of 21 normal subjects undergoing LASIK.
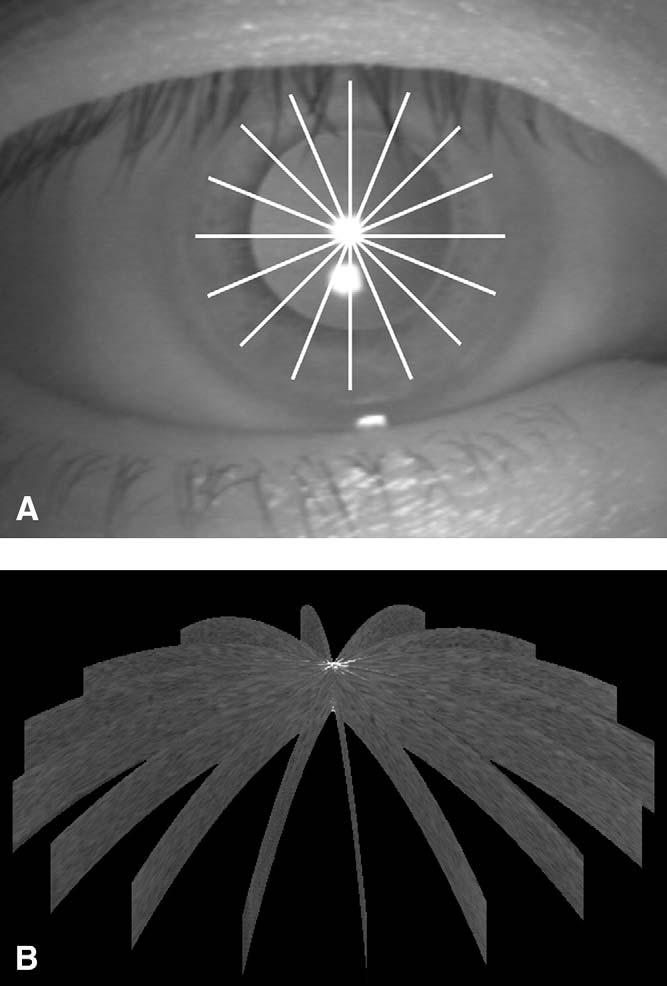
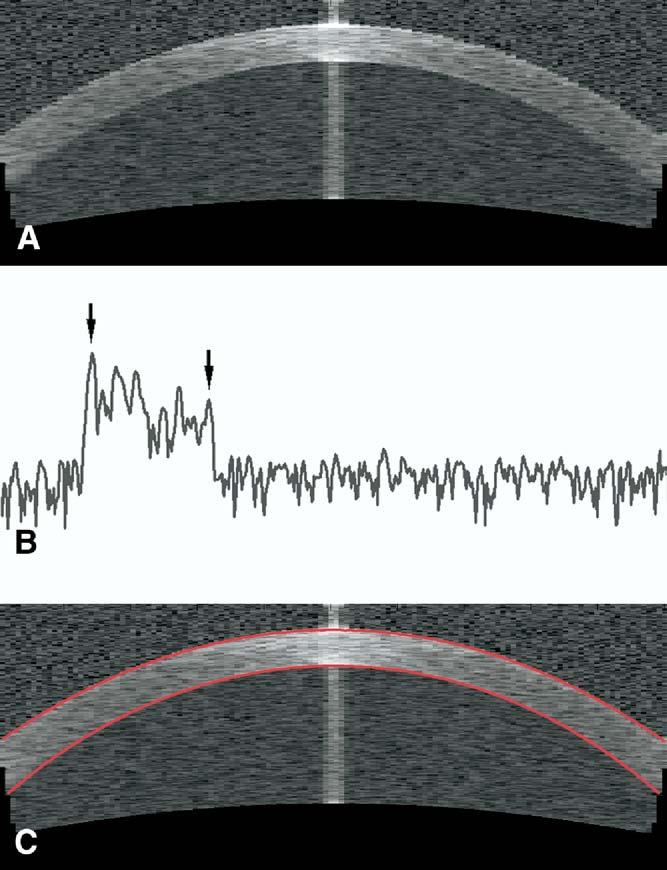
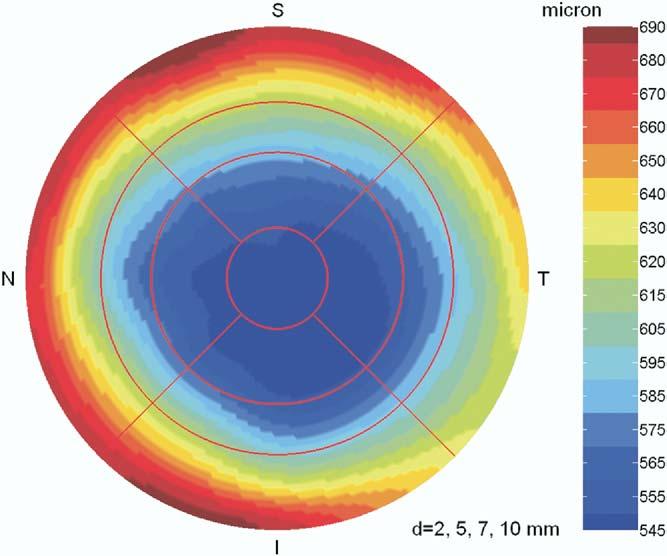
Methods: A high-speed (2000 axial scans/second) 1.3-microm-wavelength corneal and anterior segment OCT prototype was used for corneal scanning. The scan pattern consisted of 10-mm radial lines on 8 meridians centered on the vertex reflection. The entire scan pattern of 1024 a-scans was acquired in 0.5 seconds. We developed automated computer processing for 3-dimensional corneal reconstruction and measurement. Corneal thickness was measured normal to the anterior surface and presented as color pachymetry maps and zonal statistics. The maps were divided into a central zone (<2 mm) and 3 annular areas (pericentral, 2-5 mm; transitional, 5-7 mm; peripheral, 7-10 mm), which were further divided into quadrantal zones. The average, minimum, and maximum corneal thicknesses were computed for zones within the 7-mm diameter. Optical coherence tomography and ultrasound pachymetry were measured 3 times at the preoperative and 3-month postoperative visits. Reproducibility was assessed by the pooled standard deviations (SDs) of the repeated measurements.
Main outcome measures: Optical coherence tomography pachymetric map and zonal statistic, and ultrasound pachymetry.
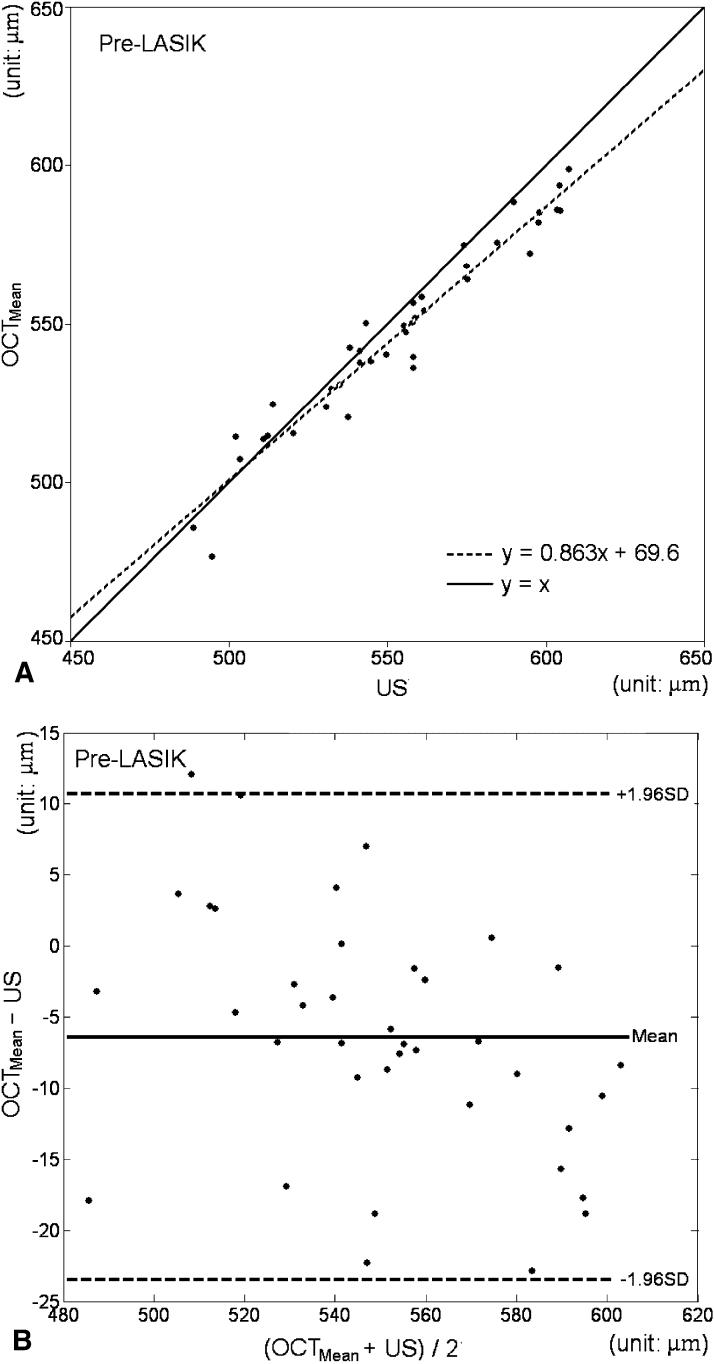
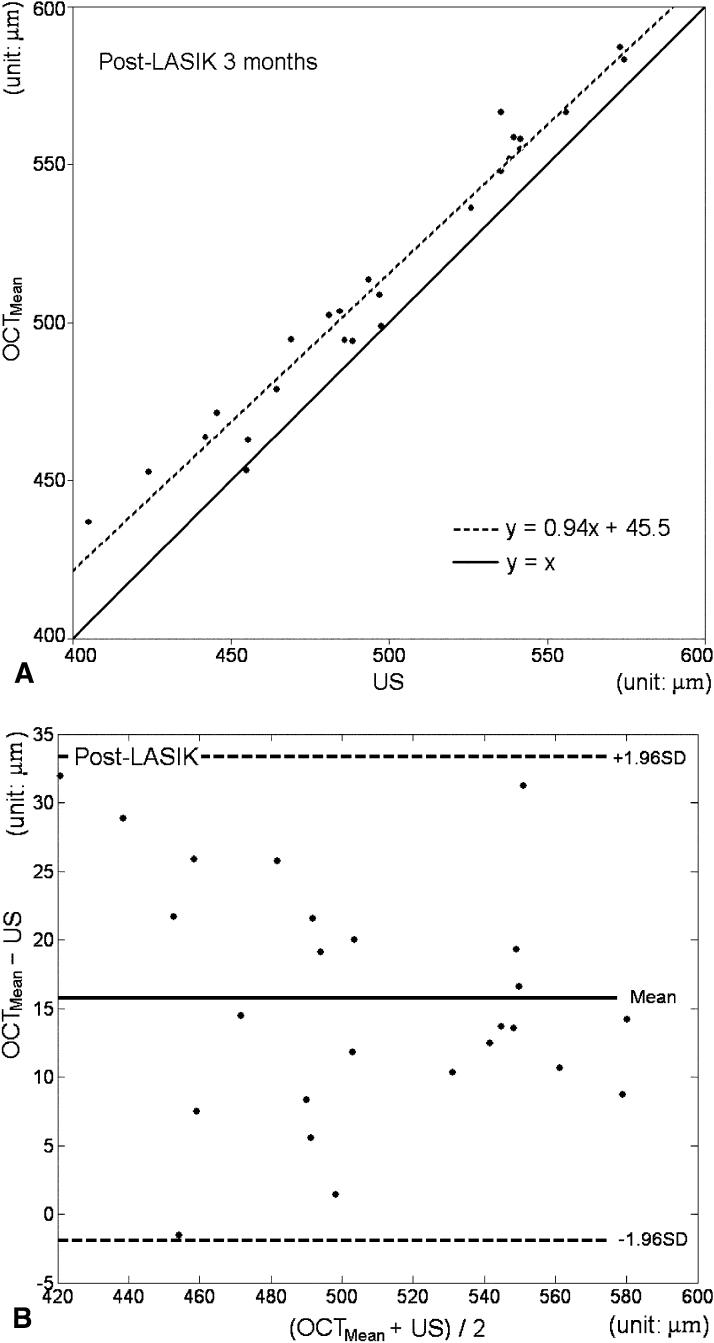
Results: Before LASIK, central corneal thicknesses (CCTs) were 546.9+/-29.4 microm (mean +/- SD) for OCT and 553.3+/-33.0 microm for ultrasound. After LASIK, CCTs were 513.7+/-44.5 microm for OCT and 498+/-46.6 microm for ultrasound. Optical coherence tomography and ultrasound CCT were highly correlated (Pearson correlation r = 0.97 before LASIK and 0.98 afterwards). Optical coherence tomography CCT was slightly less than ultrasound CCT before surgery (mean difference, -6.4 microm; 95% limits of agreement, -23.2 to 10.4 microm) but slightly greater after LASIK (15.7 microm; -1.6 to 33 microm). These differences were statistically significant, but no more than the CCT measurement differences between ultrasound pachymeters. The reproducibility of the OCT zonal pachymetry averages was roughly 2 microm.
Conclusions: High-speed OCT provided noncontact, rapid, reproducible pachymetric mapping over a wide area of the cornea. It is equivalent to ultrasound for CCT measurement before and after LASIK. This technology could be valuable for planning keratorefractive procedures and diagnosis of corneal diseases.
Figures
References
-
- Waring GO, III, Bourne WM, Edelhauser HF, Kenyon KR. The corneal endothelium. Normal and pathologic structure and function. Ophthalmology. 1982;89:531–90. - PubMed
-
- O'Neal MR, Polse KA. In vivo assessment of mechanisms controlling corneal hydration. Invest Ophthalmol Vis Sci. 1985;26:849–56. - PubMed
-
- Cheng H, Bates AK, Wood L, McPherson K. Positive correlation of corneal thickness and endothelial cell loss. Serial measurements after cataract surgery. Arch Ophthalmol. 1988;106:920–2. - PubMed
-
- Holden BA, Mertz GW, McNally JJ. Corneal swelling response to contact lenses worn under extended wear conditions. Invest Ophthalmol Vis Sci. 1983;24:218–26. - PubMed
-
- Copt RP, Thomas R, Mermoud A. Corneal thickness in ocular hypertension, primary open-angle glaucoma, and normal tension glaucoma. Arch Ophthalmol. 1999;117:14–6. - PubMed
Publication types
MeSH terms
Grants and funding
LinkOut - more resources
Full Text Sources
Other Literature Sources
