. 2006 Jun;4(6):e145.
doi: 10.1371/journal.pbio.0040145. Epub 2006 May 9.

Climate, deer, rodents, and acorns as determinants of variation in lyme-disease risk

Affiliations

Climate, deer, rodents, and acorns as determinants of variation in lyme-disease risk

Richard S Ostfeld et al. PLoS Biol. 2006 Jun.

Abstract

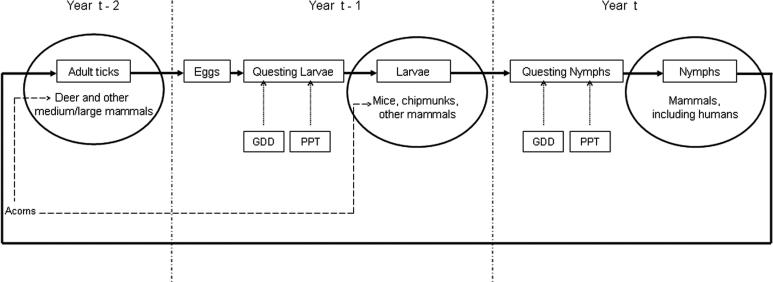
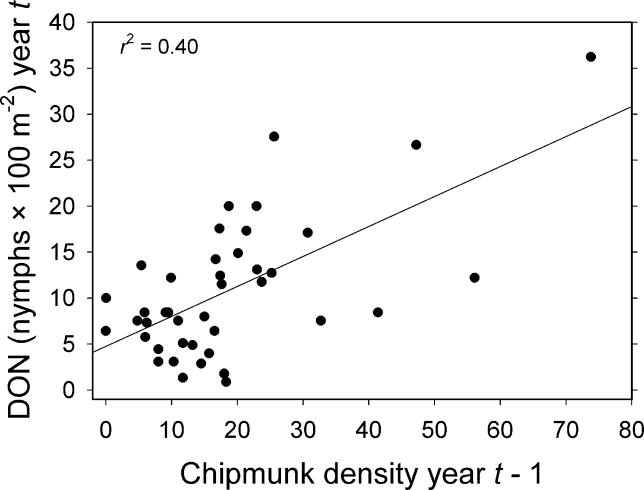
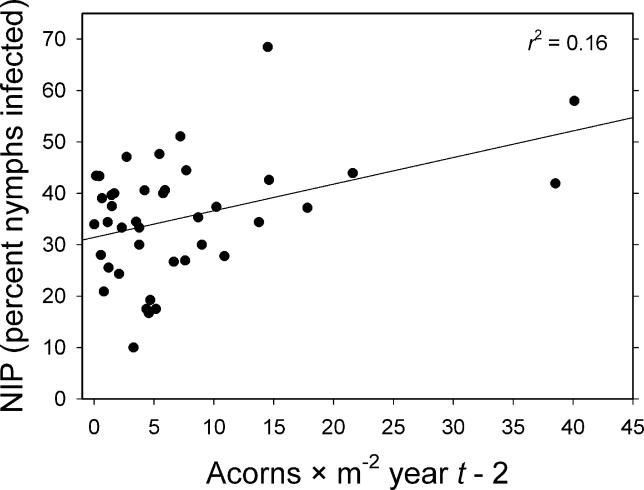
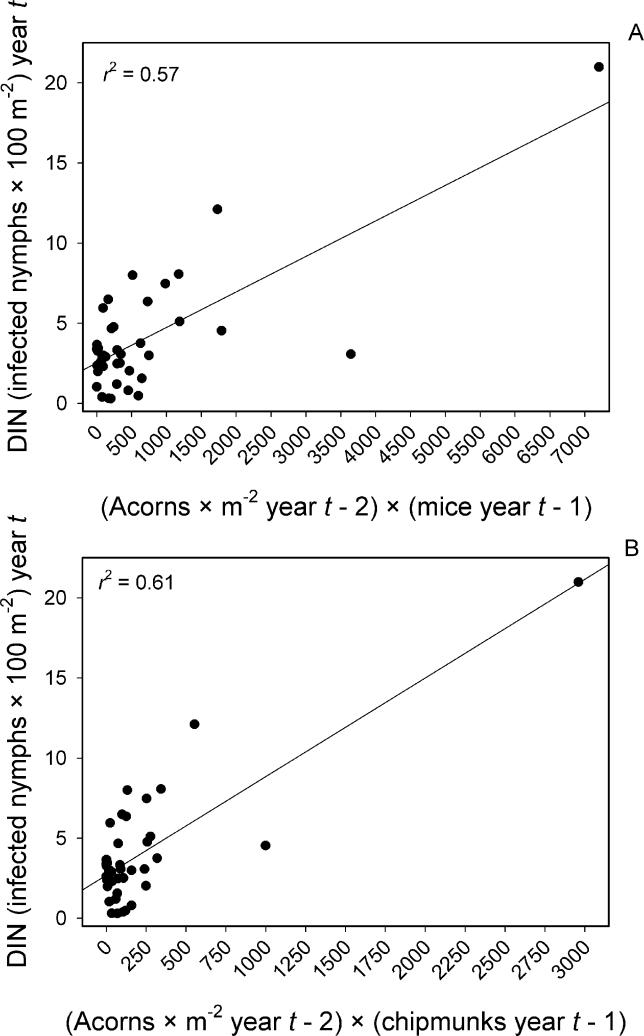
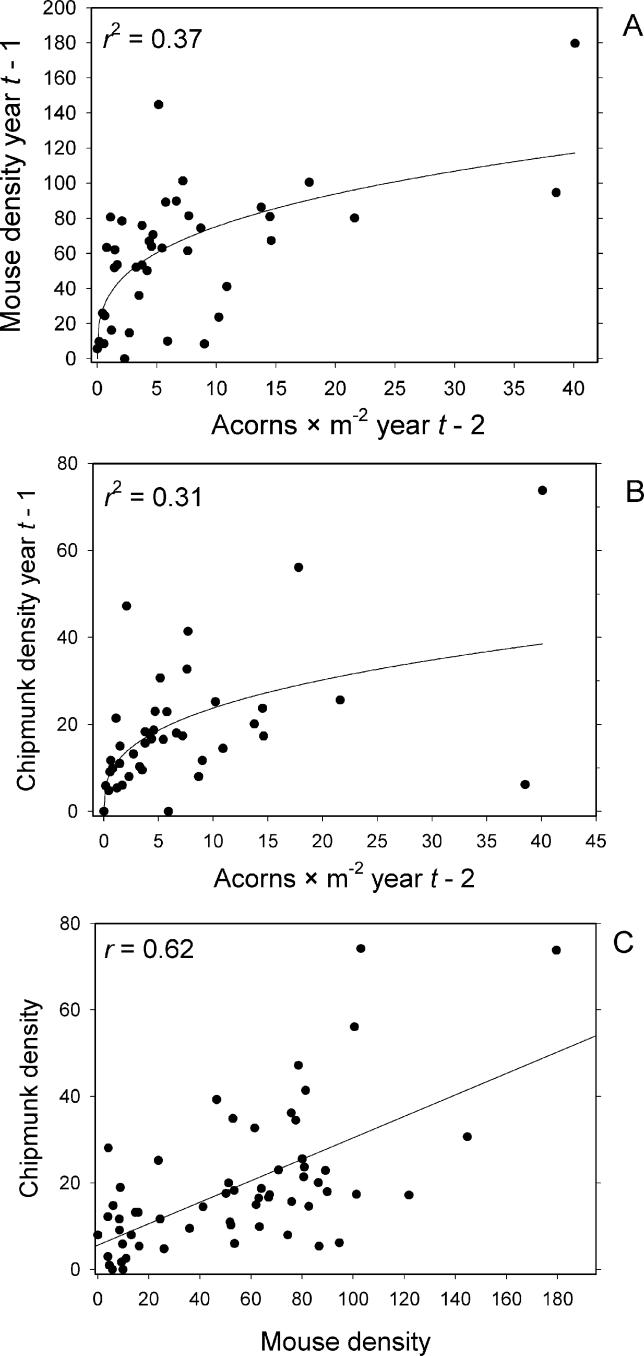
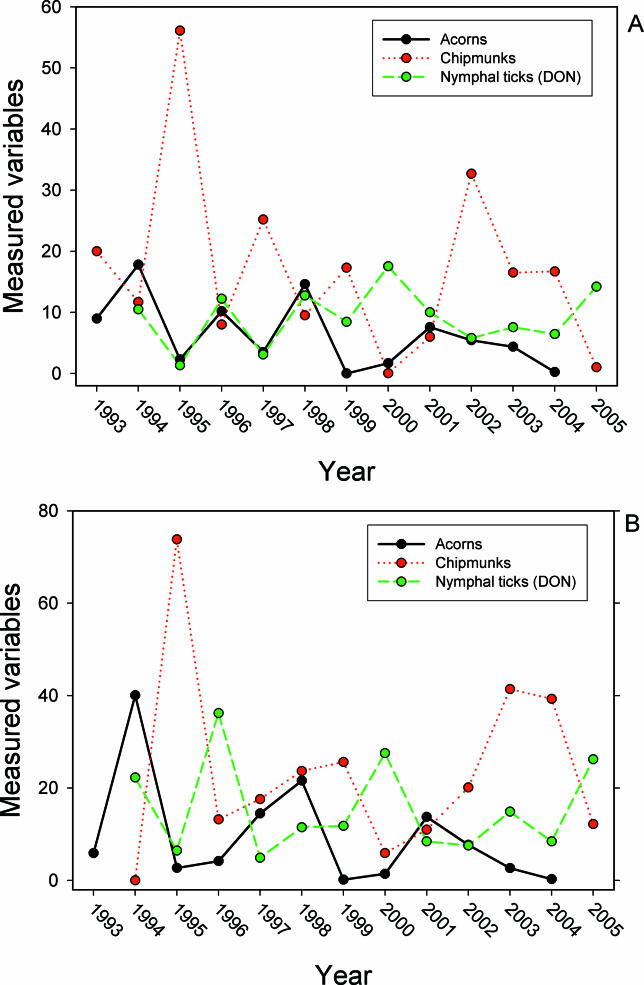
Risk of human exposure to vector-borne zoonotic pathogens is a function of the abundance and infection prevalence of vectors. We assessed the determinants of Lyme-disease risk (density and Borrelia burgdorferi-infection prevalence of nymphal Ixodes scapularis ticks) over 13 y on several field plots within eastern deciduous forests in the epicenter of US Lyme disease (Dutchess County, New York). We used a model comparison approach to simultaneously test the importance of ambient growing-season temperature, precipitation, two indices of deer (Odocoileus virginianus) abundance, and densities of white-footed mice (Peromyscus leucopus), eastern chipmunks (Tamias striatus), and acorns (Quercus spp.), in both simple and multiple regression models, in predicting entomological risk. Indices of deer abundance had no predictive power, and precipitation in the current year and temperature in the prior year had only weak effects on entomological risk. The strongest predictors of a current year's risk were the prior year's abundance of mice and chipmunks and abundance of acorns 2 y previously. In no case did inclusion of deer or climate variables improve the predictive power of models based on rodents, acorns, or both. We conclude that interannual variation in entomological risk of exposure to Lyme disease is correlated positively with prior abundance of key hosts for the immature stages of the tick vector and with critical food resources for those hosts.


Figures

Figure 1
Figure 1. Diagram of Life Cycle of the Blacklegged Tick (I. scapularis)
Shows the four life stages, egg, larva, nymph, adult, and the times during the life cycle that both abiotic (GDD, PPT), and biotic (acorns and various hosts) factors might exert influence. Year t is the year during which nymphal ticks seek hosts, including humans, and represents the focal year with respect to risk of exposure.
Figure 2
Figure 2. Effects of Population Density of Eastern Chipmunks (T. striatus) on DON
Shows relationship between number of chipmunks per 2.25-ha grid in year t−1 and DON (number per 100 m 2) in year t. This regression model for DON had the most support.
Figure 3
Figure 3. Effects of Acorn ( Quercus spp.) Density on NIP
Shows effects of acorns per square meter in year t−2 on NIP (percentage of nymphs infected with B. burgdorferi) in year t. This regression model for NIP had the most support.
Figure 4
Figure 4. Effects of Acorn and Rodent Densities on DIN
(A) Effects of the product of acorn density (acorns per square meter) in year t−2 and mouse (P. leucopus) density (number per 2.25-ha grid) in year t−1 on the density of B. burgdorferi-infected nymphs (number per 100 m 2) in year t. This regression model for DIN had the most support. (B) Effects of the product of acorn density (acorns per square meter) in year t−2 and chipmunk (T. striatus) density (number per 2.25-ha grid) in year t−1 on the density of B. burgdorferi-infected nymphs (number per 100 m 2) in year t. This regression model for DIN had nearly as much support (AIC corr) as the mouse model (A) and a higher r 2 value.
Figure 5
Figure 5. Effects of Acorn Density on Mouse and Chipmunk Densities
Shows effects of acorn density (acorns per square meter) in year t−2 on (A) mouse (P. leucopus) density (number per 2.25-ha grid) in year t−1 and (B) chipmunk (T. striatus) density (number per 2.25-ha grid) in year t−1. (C) Correlation between mouse density and chipmunk density across plots and years.
Figure 6
Figure 6. Time Series of Acorn, Tick, and Chipmunk Densities on Study Plots
Shows time series of acorn density (acorns per square meter), chipmunk density (number per 2.25-ha grid), and DON (number per 100 m 2) on the two longest-established study plots, Henry Farm (A) and Teahouse (B). Note that, typically, chipmunk density tracks acorn density with a 1-y lag, and DON tracks chipmunk density also with a 1-y lag.

Comment in

References

    1. Antonovics J, Iwasa Y, Hassell M. A generalized model of parasitoid, venereal, and vector-based transmission processes. Am Nat. 1995;145:661–675.
    1. Rogers D, Randolph S, Snow R, Hay S. Satellite imagery in the study and forecast of malaria. Nature. 2002;415:710–715. - PMC - PubMed
    1. Gubler DJ, Reiter P, Ebi KL, Yap W, Nasci R, et al. Climate variability and change in the United States: Potential impacts on vector- and rodent-borne diseases. Environ Health Perspect. 2001;109:223–233. - PMC - PubMed
    1. Harvell CD, Mitchell CE, Ward JR, Altizer S, Dobson A, et al. Climate warming and disease risks for terrestrial and marine biota. Science. 2002;296:2158–2162. - PubMed
    1. Hubalek Z. North Atlantic weather oscillation and human infectious diseases in the Czech Republic, 1951–2003. Eur J Epidemiol. 2005;20:263–270. - PubMed

Publication types