. 2006 Jun;4(6):e162.
doi: 10.1371/journal.pbio.0040162. Epub 2006 May 9.

A phosphatidylinositol-3-kinase-dependent signal transition regulates ARF1 and ARF6 during Fcgamma receptor-mediated phagocytosis

Affiliations

A phosphatidylinositol-3-kinase-dependent signal transition regulates ARF1 and ARF6 during Fcgamma receptor-mediated phagocytosis

Peter Beemiller et al. PLoS Biol. 2006 Jun.

Abstract

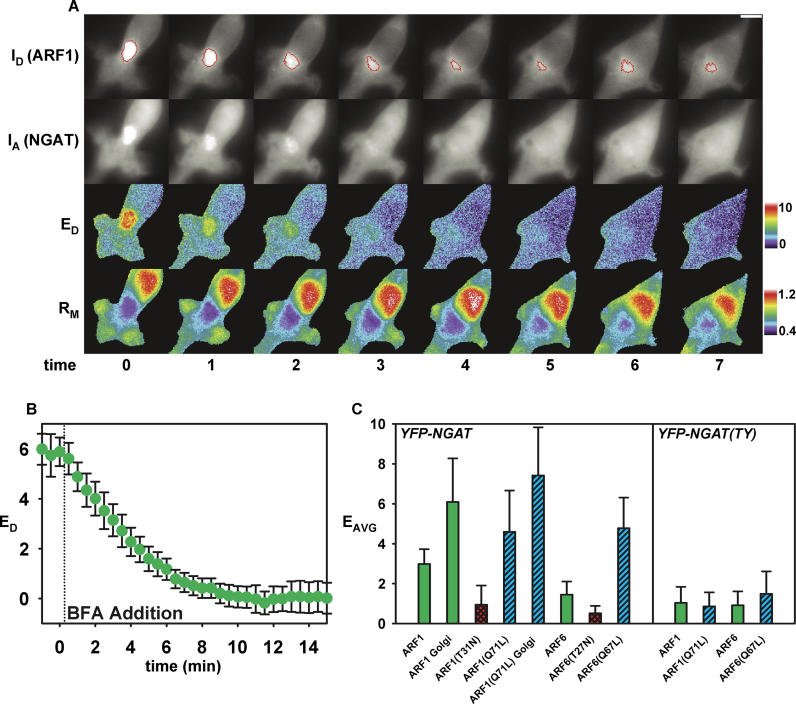
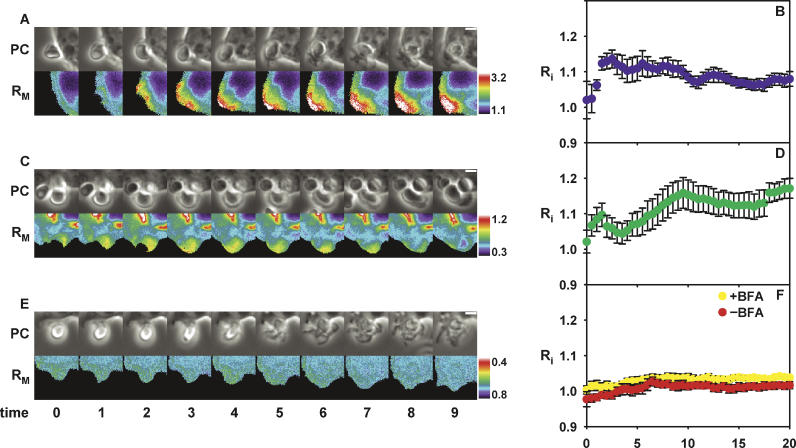
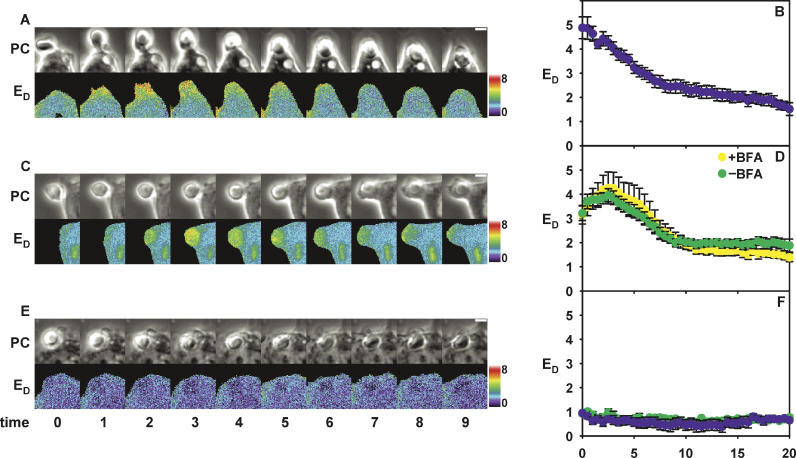
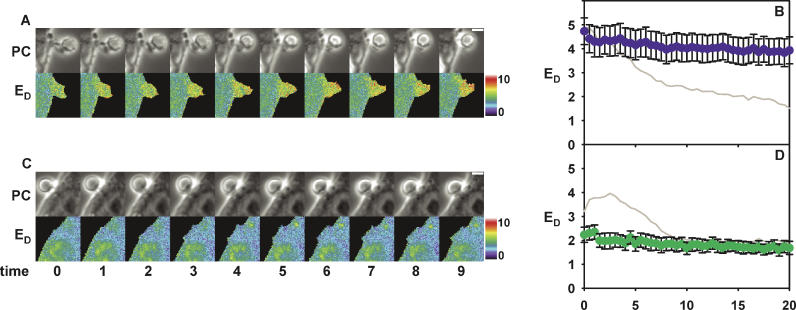
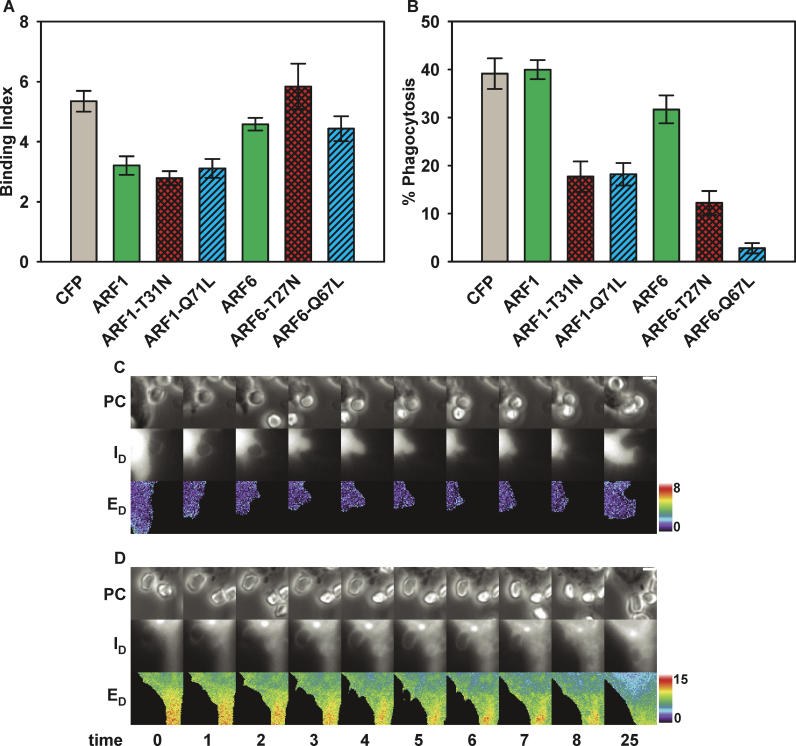
Fcgamma receptor (FcgammaR)-mediated phagocytosis of IgG-coated particles is regulated by 3'-phosphoinositides (3'PIs) and several classes of small GTPases, including ARF6 from the ADP Ribosylation Factor subfamily. The insensitivity of phagocytosis to brefeldin A (BFA), an inhibitor of certain ARF guanine nucleotide exchange factors (GEFs), previously indicated that ARF1 did not participate in phagocytosis. In this study, we show that ARF1 was activated during FcgammaR-mediated phagocytosis and that blocking normal ARF1 cycling inhibited phagosome closure. We examined the distributions and activation patterns of ARF6 and ARF1 during FcgammaR-mediated phagocytosis using fluorescence resonance energy transfer (FRET) stoichiometric microscopy of macrophages expressing CFP- or YFP-chimeras of ARF1, ARF6, and a GTP-ARF-binding protein domain. Both GTPases were activated by BFA-insensitive factors at sites of phagocytosis. ARF6 activation was restricted to the leading edge of the phagocytic cup, while ARF1 activation was delayed and delocalized over the phagosome. Phagocytic cups formed after inhibition of PI 3-kinase (PI-3K) contained persistently activated ARF6 and minimally activated ARF1. This indicates that a PI-3K-dependent signal transition defines the sequence of ARF GTPase activation during phagocytosis and that ARF6 and ARF1 coordinate different functions at the forming phagosome.


Figures

Figure 1
Figure 1. Measurement of ARF Activation Using FRET Stoichiometry
(A) Time points (in minutes) are relative to the addition of 5 μm BFA. ARF1-CFP and YFP-NGAT were enriched at the Golgi complex in transfected RAW264.7 macrophages. BFA rapidly disintegrated the Golgi network (shrinking region outlined in red in the ARF1-CFP panels), and the fluorescent markers redistributed to the cytosol. Color bars to the right of the E D and R M panels indicate the magnitude of E D expressed as a percent, and the molar ratio of YFP-NGAT/ARF1-CFP, respectively. The values to the right of the color bar indicate the values of the pixel colors at the ends of the scale. For each image series and video presented in this work, all images within a single time series are identically scaled and directly comparable. Note that in the region of the Golgi apparatus, ARF1-CFP was present at an ˜2.5-fold molar excess relative to YFP-NGAT. YFP-NGAT localization to the Golgi apparatus was mediated by ARF1-GTP binding as indicated by the high E D values at the Golgi. The FRET-based detection of ARF1-activation rapidly decreased after the addition of BFA; nearly all ARF1 activation was blocked within ˜5 minutes of the addition of BFA. The scale bar located in the upper right of the CFP time series is 6 μm. (B) The decrease in E D signals at the Golgi apparatus corresponding to loss of active ARF1 was quantified. An inclusive threshold was used to generate regions (as shown in the ARF1-CFP panels above) and to mask the E D image to measure the Golgi-associated activation of ARF1 after BFA addition. Following the addition of BFA (dotted line), ARF1-GTP levels at the Golgi immediately began to decrease; n = 6 cells. Error bars represent ± the standard error of the mean (SEM). (C) FRET values expressed as the average of the percent E A and E D signals were measured in macrophages expressing the indicated FRET partners. The dominant-negative ARF-CFP chimeras produced low, but detectable, FRET signals when co-expressed with YFP-NGAT. Conversely, co-expression of the constitutively active ARF1(Q71L)-CFP or ARF6(Q67L)-CFP chimeras with YFP-NGAT produced elevated FRET signals compared with wild-type ARF-CFP chimeras. ARF1(Q71L)-CFP and YFP-NGAT generated slightly elevated FRET signals at the Golgi apparatus. The bar plots to the right of the black line are FRET signals measured when the listed ARF-CFP chimera was co-expressed with YFP-NGAT(A193T, N194Y), an NGAT molecule with reduced ARF-GTP binding affinity. Neither the wild-type nor constitutively activated ARF-CFP chimeras generated high FRET signals when co-expressed with YFP-NGAT(A193T, N194Y). Measurements for each FRET pair are the average from at least 25 cells, and error bars represent plus/minus the standard deviation.
Figure 2
Figure 2. Ratiometric Microscopy of Arf6-YFP, ARF1-YFP, and YFP-NGAT at the Phagosome
Ratiometric fluorescence microscopy of macrophages expressing ARF1-YFP, ARF6-YFP, or YFP-NGAT chimeras with soluble CFP during phagocytosis. (A, C, and E) Phase contrast (PC) and ratiometric images of macrophages during the phagocytosis of IgG-opsonized erythrocytes. Scale bars are 3 μm. Color bars indicate the molar ratio of YFP-chimera/CFP in the adjacent R M images. (B, D, and F) Plots of the average recruitment index (R i) for temporally aligned phagocytic events. Error bars correspond to ± SEM. (A) ARF6-YFP rapidly accumulated at sites of phagocytosis; the region of high ARF6-YFP concentration advanced over the particle during pseudopod extension. (B) Analysis of multiple phagosomes indicated that the level of ARF6-YFP on the phagosome peaked during the first 2.5 min of engulfment. Following this initial rise, localization to the phagosome gradually decreased but ARF6-YFP remained associated with the phagosome well after closure at 7–8 min; n = 10 phagosomes. (C) ARF1-YFP localization to the phagosome was less pronounced than ARF6-YFP. ARF1-YFP generally accumulated over the entire phagosome and was also slightly enriched in membrane ruffles formed following closure. (D) Averaged particle-tracking results indicated ARF1-YFP association increased transiently during the first 2 min of phagosome formation, then increased further after 5 min. ARF1-YFP levels at the phagosome plateaued shortly after closure and remained elevated over the course of observation; n = 11 phagosomes. (E) The concentration of YFP-NGAT did not increase at sites of phagocytosis relative to the cytosol, indicating the level of activated ARF GTPases at the phagosome was too low to detect using YFP-NGAT ratiometric imaging. (F) Aggregate particle-tracking data never indicated recruitment of YFP-NGAT to phagosomes in the presence or absence of the ARF GEF inhibitor BFA. The time course of phagosomes formed without BFA pretreatment is the average of seven phagosomes. The plot of phagosomes formed in the presence of BFA was generated from ten phagocytic events.
Figure 3
Figure 3. Measurement of ARF6-CFP and ARF1-CFP Activation at Phagosomes
FRET microscopic measurement of ARF6-CFP and ARF1-CFP activation during phagocytosis. (A, C, and E) Phase contrast and E D images of phagocytic events from macrophages co-expressing ARF6-CFP and YFP-NGAT, ARF1-CFP and YFP-NGAT, or ARF6-CFP and YFP-mutant NGAT. Scale bars in the upper right of the phase contrast series are 3 μm. (B, D, and F) Plots of E D against phagosome progress for the corresponding pairs in (A), (C), and (E). Error bars indicate ± SEM. (A) ARF6-CFP activation peaked shortly after particle binding. Activated molecules were concentrated at the leading edge of the phagosome with lower levels of ARF6-GTP in the region trailing the advancing edge of the pseudopod. (B) Based on compiled particle-tracking results, maximum ARF6-CFP activation occurred shortly after the initiation of phagocytosis, and most of the ARF6-CFP was deactivated by the time of closure (˜7–8 min after the initiation of phagocytosis); n = 11 phagocytic events. (C) The peak in ARF1-CFP activation was slightly delayed relative to ARF6-CFP, and ARF1-GTP was not restricted to a subregion of the phagosome. ARF1-GTP levels began to decrease as the closure phase began. The persistent Golgi-associated FRET signal indicated ARF1-GTP levels at the Golgi did not fluctuate during phagocytosis. (D) Analysis of multiple phagosomes indicated ARF1-CFP was also almost entirely deactivated by the time of phagosome closure; n =14. The presence of BFA did not inhibit the activation of ARF1-CFP at sites of phagocytosis, suggesting ARF1 is activated by BFA-insensitive GEFs during phagocytosis. 14 phagocytic events that occurred in the presence of 5 μM BFA were analyzed by particle-tracking analysis. (E) ARF6-CFP produced very low E D values at sites of phagocytosis when co-expressed with YFP-NGAT(A193T, N194Y). (F) Multiple phagosomes from macrophages co-expressing the binding-deficient YFP-NGAT(A193T, N194Y) with ARF6-CFP (blue) or ARF1-CFP (green) never demonstrated significant FRET signals. ARF1 results are the average of 15 phagosomes; ARF6 results represent eight phagosomes.
Figure 4
Figure 4. Activation of ARF6 and ARF1 during Phagocytosis in Macrophages Pretreated with LY294002
Macrophages co-expressing ARF6-CFP or ARF1-CFP with YFP-NGAT were treated with LY294002 for 30 min to inhibit PI-3K. (A) Phase contrast and E D images from an RAW264.7 macrophage expressing ARF6-CFP and YFP-NGAT. Binding of the IgG-opsonized erythrocyte led to activation of ARF6-CFP, but the phagosome never closed, and ARF6-CFP was not deactivated. (B) The particle-tracking analysis for ten phagosomes from cells co-expressing ARF6-CFP and YFP-NGAT indicated that the magnitude of ARF6 activation in response to FcγR ligation was not reduced, but ARF6 deactivation could not proceed in the presence of PI-3K inhibitor. (C) Phase contrast and E D images from a macrophage expressing ARF1-CFP and YFP-NGAT did not demonstrate a phagosome-localized activation of ARF1 in the presence of LY294002. However, ARF1-CFP activation at the Golgi apparatus appeared to be unaffected (crescent-shaped region of high E D near the nucleus). (D) Measurement of ARF1 activation in LY294002 by particle-tracking analysis of nine phagosomes showed that a consistent but low level of ARF1 was bound to GTP at phagocytic cups; these macrophages did not display the transient, localized activation of ARF1 seen in control cells not treated with LY294002. Gray lines in (B) and (D) are the activation profiles in the absence of LY294002 for ARF6 and ARF1, respectively, taken from Figure 3B and 3D. Error bars represent ± SEM. Scale bars in (A) and (C) are 3 μm.
Figure 5
Figure 5. Effect of ARF1 and ARF6 Cycling Mutants on the Phagocytic Efficiciency of Macrophages and Imaging of ARF1(T31N)- and ARF1(Q71L)-Arrested Phagosomes
(A) The effects of expression of the ARF-CFP chimeras on the binding of opsonized target particles. The ARF1-CFP chimeras generally reduced the binding index of macrophages, while the ARF6-CFP chimeras did not affect target particle binding. (B) Phagocytic indexes were measured for macrophages expressing CFP fusions of ARF1, ARF1(T31N), ARF1(Q71L), ARF6, ARF6(T27N), or ARF6(Q67L). The number of internalized and bound, uninternalized erythrocytes were counted for macrophages expressing the various constructs. Although ARF1-CFP did not reduce phagocytosis, expression of ARF1(T31N)-CFP or ARF1(Q71L)-CFP led to a reduction in phagocytic efficiency. Similarly, ARF6-CFP, in its wild-type form, produced a small inhibition of phagocytosis, but the constitutively activated and dominant-negative forms of ARF6-CFP impaired phagocytosis to a much greater degree. For all constructs except ARF6(Q67L)-CFP, results are the average of at least two experiments in which three coverslips were assayed. At least 25 macrophages were counted per coverslip. The ARF6(Q67L)-CFP results are from 31 macrophages counted on six coverslips. The error bars in (A) and (B) represent ± SEM. (C and D) Time-lapse fluorescence microscopy from macrophages expressing YFP-NGAT and ARF1(T31N)-CFP or ARF1(Q71L)-CFP. Note that the last image in the series was taken 25 min after the initiation of phagocytosis. Control RAW264.7 macrophages typically required 6–8 min to complete phagocytosis from the onset of pseudopod extension. The scale bars in the far-right phase contrast panels are 3 μm. (C) In macrophages expressing ARF1(T31N)-CFP, phagocytic cups formed, but the macrophages failed to close the phagosome. (D) Expression of ARF1(Q71L)-CFP also prevented phagosome closure. The phagocytic cup is visible in the fluorescence image.

Comment in

References

    1. Hackam DJ, Rotstein OD, Zhang W, Gruenheid S, Gros P, et al. Host resistance to intracellular infection: Mutation of natural resistance–associated macrophage protein 1 (Nramp1) impairs phagosomal acidification. J Exp Med. 1998;188:351–364. - PMC - PubMed
    1. Cox D, Tseng CC, Bjekic G, Greenberg S. A requirement for phosphatidylinositol 3-kinase in pseudopod extension. J Biol Chem. 1999;274:1240–1247. - PubMed
    1. Zhang Q, Cox D, Tseng CC, Donaldson JG, Greenberg S. A requirement for ARF6 in Fcγ receptor–mediated phagocytosis in macrophages. J Biol Chem. 1998;273:19977–19981. - PubMed
    1. Niedergang F, Colucci-Guyon E, Dubois T, Raposo G, Chavrier P. ADP ribosylation factor 6 is activated and controls membrane delivery during phagocytosis in macrophages. J Cell Biol. 2003;161:1143–1150. - PMC - PubMed
    1. Honda A, Nogami M, Yokozeki T, Yamazaki M, Nakamura H, et al. Phosphatidylinositol 4-phosphate 5-kinase α is a downstream effector of the small G protein ARF6 in membrane ruffle formation. Cell. 1999;99:521–532. - PubMed

Publication types

MeSH terms