

The trans-silencing capacity of invertedly repeated transgenes depends on their epigenetic state in tobacco
- PMID: 16670434
- PMCID: PMC1456325
- DOI: 10.1093/nar/gkl180
The trans-silencing capacity of invertedly repeated transgenes depends on their epigenetic state in tobacco
Abstract
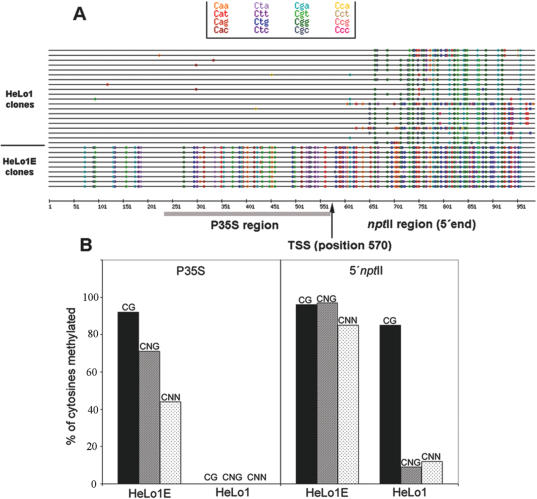
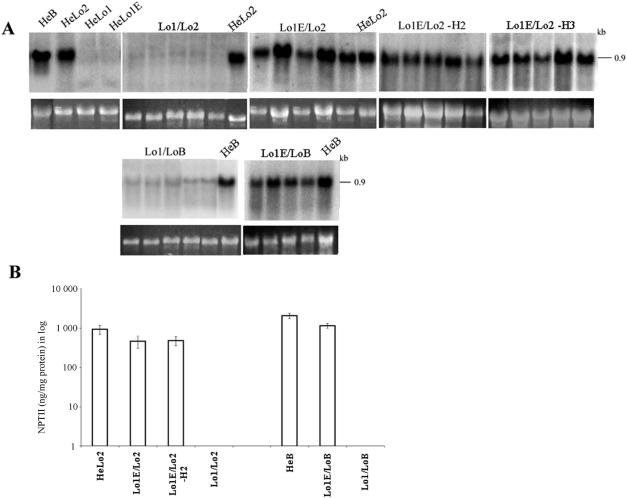
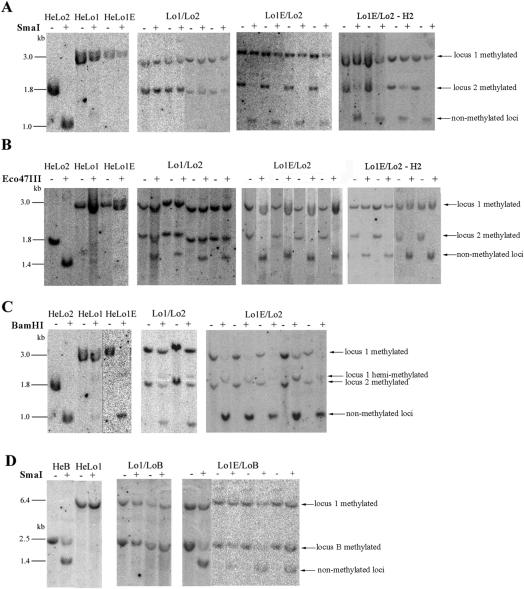
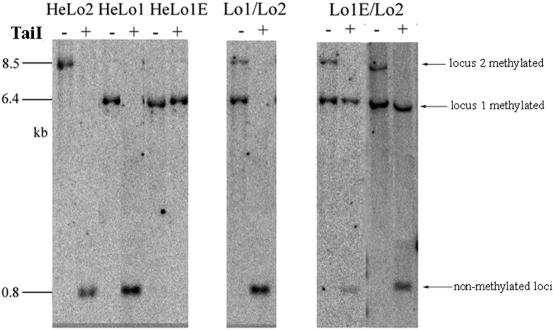
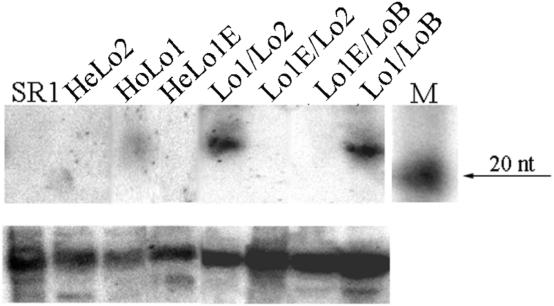
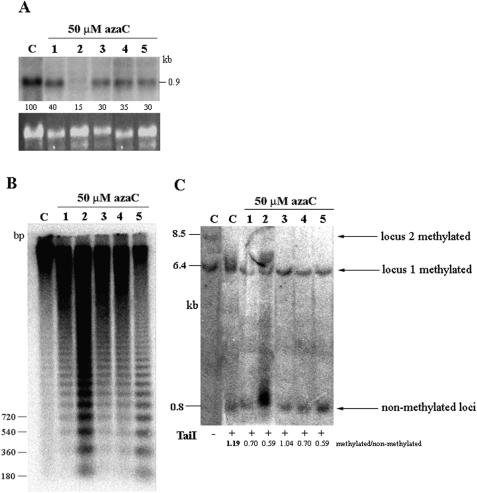
We studied the in trans-silencing capacities of a transgene locus that carried the neomycin phosphotransferase II reporter gene linked to the 35S promoter in an inverted repeat (IR). This transgene locus was originally posttranscriptionally silenced but switched to a transcriptionally silenced epiallele after in vitro tissue culture. Here, we show that both epialleles were strongly methylated in the coding region and IR center. However, by genomic sequencing, we found that the 1.0 kb region around the transcription start site was heavily methylated in symmetrical and non-symmetrical contexts in transcriptionally but not in posttranscriptionally silenced epilallele. Also, the posttranscriptionally silenced epiallele could trans-silence and trans-methylate homologous transgene loci irrespective of their genomic organization. We demonstrate that this in trans-silencing was accompanied by the production of small RNA molecules. On the other hand, the transcriptionally silenced variant could neither trans-silence nor trans-methylate homologous sequences, even after being in the same genetic background for generations and meiotic cycles. Interestingly, 5-aza-2-deoxy-cytidine-induced hypomethylation could partially restore signaling from the transcriptionally silenced epiallele. These results are consistent with the hypothesis that non-transcribed highly methylated IRs are poor silencers of homologous loci at non-allelic positions even across two generations and that transcription of the inverted sequences is essential for their trans-silencing potential.
Figures
Similar articles
-
Cross-talk between posttranscriptionally silenced neomycin phosphotransferase II transgenes.FEBS Lett. 2000 Feb 4;467(1):41-6. doi: 10.1016/s0014-5793(00)01076-0. FEBS Lett. 2000. PMID: 10664453
-
Cell culture-induced gradual and frequent epigenetic reprogramming of invertedly repeated tobacco transgene epialleles.Plant Physiol. 2009 Mar;149(3):1493-504. doi: 10.1104/pp.108.133165. Epub 2009 Jan 7. Plant Physiol. 2009. PMID: 19129419 Free PMC article.
-
Paramutation of tobacco transgenes by small RNA-mediated transcriptional gene silencing.Epigenetics. 2011 May;6(5):650-60. doi: 10.4161/epi.6.5.15764. Epub 2011 May 1. Epigenetics. 2011. PMID: 21521939 Free PMC article.
-
Role of inverted DNA repeats in transcriptional and post-transcriptional gene silencing.Plant Mol Biol. 2000 Jun;43(2-3):243-60. doi: 10.1023/a:1006491613768. Plant Mol Biol. 2000. PMID: 10999408 Review.
-
A paragenetic perspective on integration of RNA silencing into the epigenome and its role in the biology of higher plants.Cold Spring Harb Symp Quant Biol. 2006;71:481-5. doi: 10.1101/sqb.2006.71.023. Cold Spring Harb Symp Quant Biol. 2006. PMID: 17381330 Review.
Cited by
-
Generation of single-copy T-DNA transformants in Arabidopsis by the CRE/loxP recombination-mediated resolution system.Plant Physiol. 2007 Dec;145(4):1171-82. doi: 10.1104/pp.107.104067. Epub 2007 Aug 10. Plant Physiol. 2007. PMID: 17693537 Free PMC article.
-
Low relative humidity triggers RNA-directed de novo DNA methylation and suppression of genes controlling stomatal development.J Exp Bot. 2012 Jun;63(10):3799-813. doi: 10.1093/jxb/ers076. Epub 2012 Mar 21. J Exp Bot. 2012. PMID: 22442411 Free PMC article.
-
Reconstructing de novo silencing of an active plant retrotransposon.Nat Genet. 2013 Sep;45(9):1029-39. doi: 10.1038/ng.2703. Epub 2013 Jul 14. Nat Genet. 2013. PMID: 23852169
-
Epigenetic switches of tobacco transgenes associate with transient redistribution of histone marks in callus culture.Epigenetics. 2013 Jun;8(6):666-76. doi: 10.4161/epi.24613. Epub 2013 Apr 26. Epigenetics. 2013. PMID: 23770973 Free PMC article.
-
Faithful inheritance of cytosine methylation patterns in repeated sequences of the allotetraploid tobacco correlates with the expression of DNA methyltransferase gene families from both parental genomes.Mol Genet Genomics. 2009 Apr;281(4):407-20. doi: 10.1007/s00438-008-0420-8. Epub 2009 Jan 9. Mol Genet Genomics. 2009. PMID: 19132393
References
-
- Vaucheret H., Fagard M. Transcriptional gene silencing in plants: targets, inducers and regulators. Trends Genet. 2001;17:29–35. - PubMed
-
- Vaucheret H., Béclin C., Fagard M. Post-transcriptional gene silencing in plants. J. Cell Sci. 2001;114:3083–3091. - PubMed
-
- Sijen T., Vijn I., Rebocho A., van Blokland R., Roelofs D., Mol J.N.M., Kooter J.M. Transcriptional and posttranscriptional gene silencing are mechanistically related. Curr. Biol. 2001;11:436–440. - PubMed
-
- Garrick D., Fiering S., Martin D.I.K., Whitelaw E. Repeat-induced gene silencing in mammals. Nature Genet. 1998;18:56–59. - PubMed
Publication types
MeSH terms
Substances
LinkOut - more resources
Full Text Sources
Other Literature Sources
