. 2006 May;116(5):1317-26.
doi: 10.1172/JCI25308.

Anti-IL-23 therapy inhibits multiple inflammatory pathways and ameliorates autoimmune encephalomyelitis

Affiliations

Anti-IL-23 therapy inhibits multiple inflammatory pathways and ameliorates autoimmune encephalomyelitis

Yi Chen et al. J Clin Invest. 2006 May.

Abstract

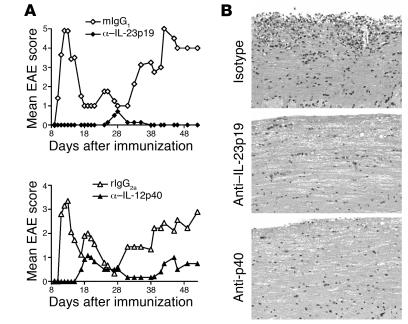
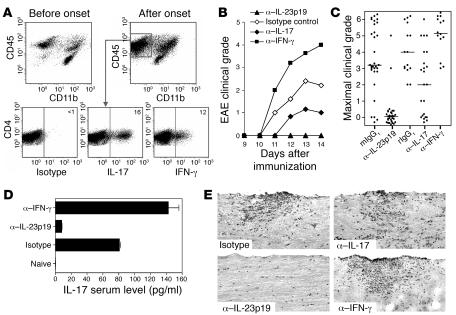
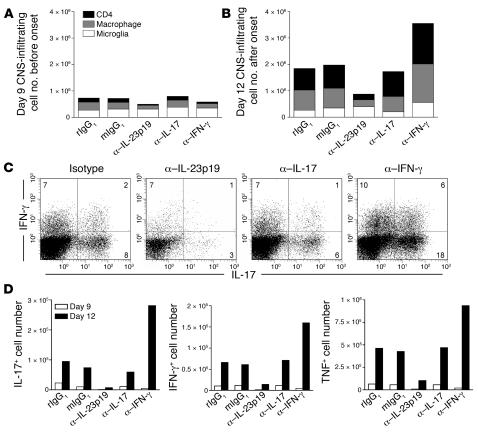
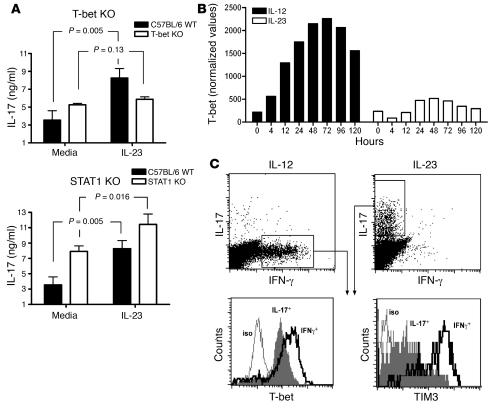
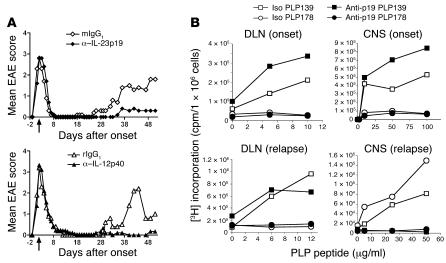
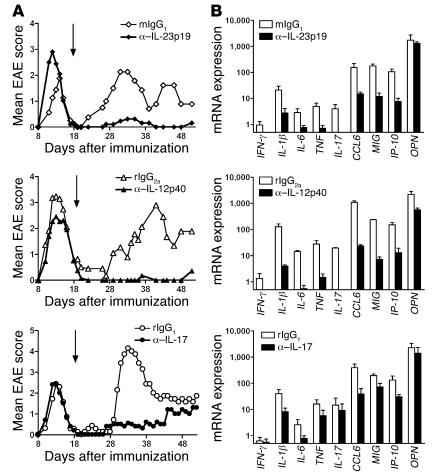
IL-23 is a member of the IL-12 cytokine family that drives a highly pathogenic T cell population involved in the initiation of autoimmune diseases. We have shown that IL-23-dependent, pathogenic T cells produced IL-17 A, IL-17 F, IL-6, and TNF but not IFN-gamma or IL-4. We now show that T-bet and STAT1 transcription factors are not required for the initial production of IL-17. However, optimal IL-17 production in response to IL-23 stimulation appears to require the presence of T-bet. To explore the clinical efficacy of targeting the IL-23 immune pathway, we generated anti-IL-23p19-specific antibodies and tested to determine whether blocking IL-23 function can inhibit EAE, a preclinical animal model of human multiple sclerosis. Anti-IL-23p19 treatment reduced the serum level of IL-17 as well as CNS expression of IFN-gamma, IP-10, IL-17, IL-6, and TNF mRNA. In addition, therapeutic treatment with anti-IL-23p19 during active disease inhibited proteolipid protein (PLP) epitope spreading and prevented subsequent disease relapse. Thus, therapeutic targeting of IL-23 effectively inhibited multiple inflammatory pathways that are critical for driving CNS autoimmune inflammation.


Figures

Figure 1
Figure 1. Anti–IL-23 treatment inhibits acute EAE.
(A) Average clinical score of mice treated with 1 mg of anti–IL-23p19 (clone MB74) or anti–IL12p40 (clone C17.8) injected at day –1 and day 6 of EAE priming. One of 4 experiments is shown. Disease incidence and average disease onset of all mice are shown in Table 1. (B) Routine H&E histology of spinal cords from antibody-treated mice taken at days 30–40 of immunization. Original magnification, ×200. Representative micrographs of anti–IL-23p19 and -p40 treated groups show no inflammation in the white matter of the CNS. Rat IgG2a (rIgG2a) isotype control group shows infiltration of inflammatory cells in the lumbar region of the spinal cord. Mouse IgG1 (mIgG1) controls showed similar levels of CNS inflammatory cellular infiltration (not shown).
Figure 2
Figure 2. Blockade of IL-23 and IL-17 but not IFN-γ protects from EAE.
(A) Phenotypic and intracellular cytokine analysis of CNS-infiltrating cells in the brain and spinal cord of WT mice before and after EAE onset. Intracellular IL-17 and IFN-γ production by CD4+ CNS-infiltrating cells isolated from PLP-immunized SJL mice immediately following ex vivo stimulation with PMA/ionomycin for 4 hours prior to analysis. Data are representative of at least 5 independent experiments. (B) Average clinical score of mice (n ≥ 5) treated with 1 mg of indicated mAbs injected at day –1 and day 6 of immunization. Data are representative of at least 3 experiments. (C) Filled circles represent peak severity of clinical disease for individual mice of the indicated antibody treatment group. Data for the anti–IFN-γ treatment group are compiled from 3 separate experiments whereas data from the anti–IL-23p19 and anti–IL-17 groups are from at least 5 experiments. (D) Mice were treated with anti–IL-23p19 or anti–IFN-γ at day –1 and day 6 of immunization. Serum was prepared for IL-17 ELISA 2 days before expected onset. The limit of detection for serum IL-17 is 10 pg/ml. Results shown are averages of 5 mice per treatment group ± SEM and are representative of 2 experiments. (E) Routine H&E histology of spinal cords from antibody-treated mice taken at peak disease. Representative micrograph of anti–IL-23p19 treated mice shows no inflammation in the white matter of the CNS. Isotype control mAb–, anti–IL-17–, and anti–IFN-γ–treated mice show intense infiltration of inflammatory cells in the lumbar region of the spinal cord.
Figure 3
Figure 3. Anti–IL-23p19 mAbs inhibit CNS infiltration of IL-17–, IFN-γ– and TNF-producing CD4+ T cells.
The total number of CD4+ T cells, CD45hiCD11b+ macrophages, and CD45loCD11b+ microglia in the brain and spinal cord of antibody-treated mice was determined by FACS analysis. CNS mononuclear cells were isolated either (A) 2 days before expected EAE onset or (B) 2 days after disease onset. (C) Intracellular expression of IL-17 and IFN-γ in CD4+ T cells isolated from the CNS at peak disease. IL-17 and IFN-γ production by CD4+ CNS-infiltrating cells were determined following immediate ex vivo stimulation with PMA/ionomycin for 4 hours prior to intracellular cytokine analysis. Data are representative of 2 independent experiments. (D) Cells isolated from the brains and spinal cords of 3 mice were pooled for intracellular cytokine analysis. Data are the average number of IL-17–, IFN-γ–, and TNF-producing CNS-infiltrating T cells per animal. All cell samples were stimulated with PMA/ionomycin for 4 hours prior to analysis. All plots were gated on live CD4+ T cells and are representative of 2 independent experiments.
Figure 4
Figure 4. T-bet and TIM3 expression in IFN-γ– and IL-17–producing T cells.
(A) Lymph node cells from naive C57BL/6 WT mice and T-bet– or STAT1-deficient mice were stimulated with soluble anti-CD3 for 48 hours in the presence or absence of IL-23. IL-17 levels in the culture supernatant were measured by ELISA. Data are mean cytokine production ± SD of separate lymph node cultures from 3 mice and are representative of 3 independent experiments. (B) SJL mice were immunized with PLP139–151, and DLN cells were cultured with 20 μg/ml PLP peptide either in Th1-promoting conditions (IL-12 with blocking anti–IL-17 and anti–IL-23p19) or Th17-promoting conditions (IL-23 with blocking anti–IFN-γ and anti–IL-12p35). Cells were collected at 0, 4, 12, 24, 48, 72, 96, and 120 hours after culture. mRNA for T-bet was quantified by real-time PCR (TaqMan) and normalized to ubiquitin. Data are representative of 3 independent experiments. (C) At 96 hours, IL-17– and IFN-γ–producing CD4+ T cells were identified by intracellular cytokine staining. T-bet and TIM3 expression were determined by costaining of cytokine-positive cells for T-bet (clone 4B10) or TIM3 (clone 8B.2C12).
Figure 5
Figure 5. Anti–IL-23 therapy inhibits PLP epitope spreading and relapsing EAE.
(A) Average clinical score of mice treated with anti–IL-23p19 (clone MB490) or anti-p40 antibody on the day of EAE onset. The first antibody dose was given by the i.v. route at the first sign of clinical disease and the 2 subsequent doses by the s.c. route at days 7 and 14 after EAE onset. One of 3 experiments is shown. Disease relapse incidence and histopathology scores are shown in Table 3. Arrows indicate the day of initial mAb treatment (day of disease onset). (B) Epitope spreading was determined by analysis of DLN cells or purified CNS mononuclear cells for response to PLP139–151 or PLP178–191 on either the day of disease onset or during disease relapse. Purified CNS mononuclear cells from mice treated with anti–IL-23p19 or isotype control mAbs were stimulated for 4 days with PLP peptides then pulsed with 3[H] 16 hours before proliferation assay. Cells from 3 to 4 mice of each treatment group were pooled and cultured at indicated PLP peptide concentration in triplicate wells. Results from 1 of 2 experiments are shown.
Figure 6
Figure 6. Anti–IL-23 therapy during disease remission inhibits CNS expression of proinflammatory cytokines and prevents EAE relapse.
(A) Average clinical score of mice given the first treatment dose of anti–IL-23p19 (clone MB490), anti–IL-17 (clone 1D10), or anti-p40 (clone C17.8) during disease remission. The first antibody dose (1 mg) was given by the i.v. route at day 18 after immunization and the 2 subsequent doses (1 mg/dose) by the s.c. route at 7 and 14 days after the initial treatment. Results from 1 of 2 experiments are shown. Details on incidence of disease relapse and histopathology scores are shown in Table 3. Arrows indicate day of initial mAb treatment (during disease remission). (B) Quantitative analysis of proinflammatory gene expression levels of spinal cords taken at peak disease relapse of the isotype control groups (day 30–40 after immunization). Note the log10 scale on the x axis. Error bars show SD of 4–5 representative animals from each treatment group. TaqMan gene expression results were normalized to ubiquitin, a housekeeping gene. Results are representative of 2 experiments. OPN, osteopontin.

References

    1. Martino G., Hartung H.P. Immunopathogenesis of multiple sclerosis: the role of T cells. Curr. Opin. Neurol. 1999;12:309–321. - PubMed
    1. Behi M.E., et al. New insights into cell responses involved in experimental autoimmune encephalomyelitis and multiple sclerosis. Immunol. Lett. 2005;96:11–26. - PubMed
    1. O’Garra A., Arai N. The molecular basis of T helper 1 and T helper 2 cell differentiation. Trends Cell Biol. 2000;10:542–550. - PubMed
    1. Shtrichman R., Sanuel C.E. The role of gamma interferon in antimicrobial immunity. Curr. Opin. Microbiol. 2001;4:251–259. - PubMed
    1. Airoldi I., et al. The IL-12Rβ2 gene functions as a tumor suppressor in human B cell malignancies. J. Clin. Invest. 2004;113:1651–1659. doi: 10.1172/JCI200420303. - DOI - PMC - PubMed

MeSH terms