

Time trend and age-period-cohort effect on kidney cancer mortality in Europe, 1981-2000
- PMID: 16672041
- PMCID: PMC1468405
- DOI: 10.1186/1471-2458-6-119
Time trend and age-period-cohort effect on kidney cancer mortality in Europe, 1981-2000
Abstract
Background: The incorporation of diagnostic and therapeutic improvements, as well as the different smoking patterns, may have had an influence on the observed variability in renal cancer mortality across Europe. This study examined time trends in kidney cancer mortality in fourteen European countries during the last two decades of the 20th century.
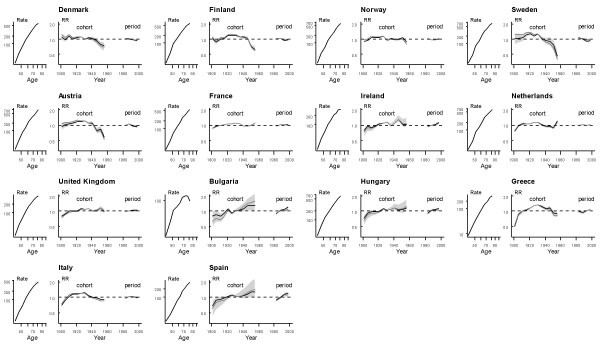
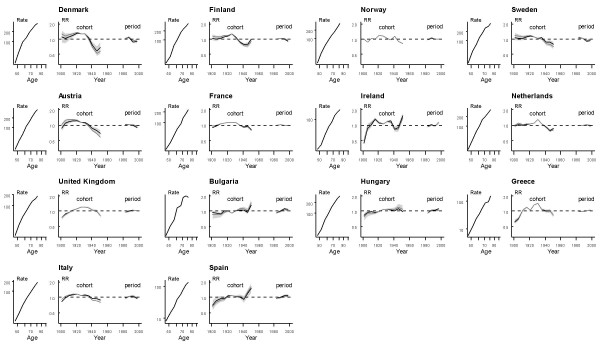
Methods: Kidney cancer deaths and population estimates for each country during the period 1981-2000 were drawn from the World Health Organization Mortality Database. Age- and period-adjusted mortality rates, as well as annual percentage changes in age-adjusted mortality rates, were calculated for each country and geographical region. Log-linear Poisson models were also fitted to study the effect of age, death period, and birth cohort on kidney cancer mortality rates within each country.
Results: For men, the overall standardized kidney cancer mortality rates in the eastern, western, and northern European countries were 20, 25, and 53% higher than those for the southern European countries, respectively. However, age-adjusted mortality rates showed a significant annual decrease of -0.7% in the north of Europe, a moderate rise of 0.7% in the west, and substantial increases of 1.4% in the south and 2.0% in the east. This trend was similar among women, but with lower mortality rates. Age-period-cohort models showed three different birth-cohort patterns for both men and women: a decrease in mortality trend for those generations born after 1920 in the Nordic countries, a similar but lagged decline for cohorts born after 1930 in western and southern European countries, and a continuous increase throughout all birth cohorts in eastern Europe. Similar but more heterogeneous regional patterns were observed for period effects.
Conclusion: Kidney cancer mortality trends in Europe showed a clear north-south pattern, with high rates on a downward trend in the north, intermediate rates on a more marked rising trend in the east than in the west, and low rates on an upward trend in the south. The downward pattern observed for cohorts born after 1920-1930 in northern, western, and southern regions suggests more favourable trends in coming years, in contrast to the eastern countries where birth-cohort pattern remains upward.
Figures
References
-
- Lopez-Abente G, Pollan M, Vergara A, Ardanaz E, Moreo P, Moreno C, Ruiz M. Tendencia temporal de la incidencia de cáncer en Navarra y Zaragoza. Gac Sanit. 2000;14:100–109. - PubMed
-
- Ferlay J, Bray F, Sankila R, Parkin DM. EUCAN: Cancer incidence, mortality and prevalence in the European Union version 50 IARC CancerBase No 4. Lyon: IARC Press; 1999.
Publication types
MeSH terms
LinkOut - more resources
Full Text Sources
Medical
