

Enhanced automated function prediction using distantly related sequences and contextual association by PFP
- PMID: 16672240
- PMCID: PMC2242549
- DOI: 10.1110/ps.062153506
Enhanced automated function prediction using distantly related sequences and contextual association by PFP
Abstract
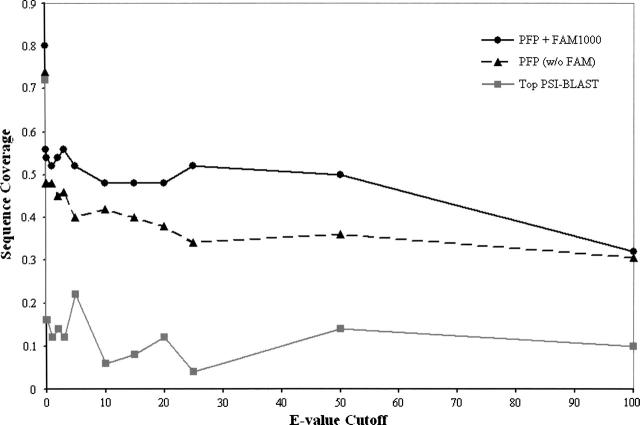
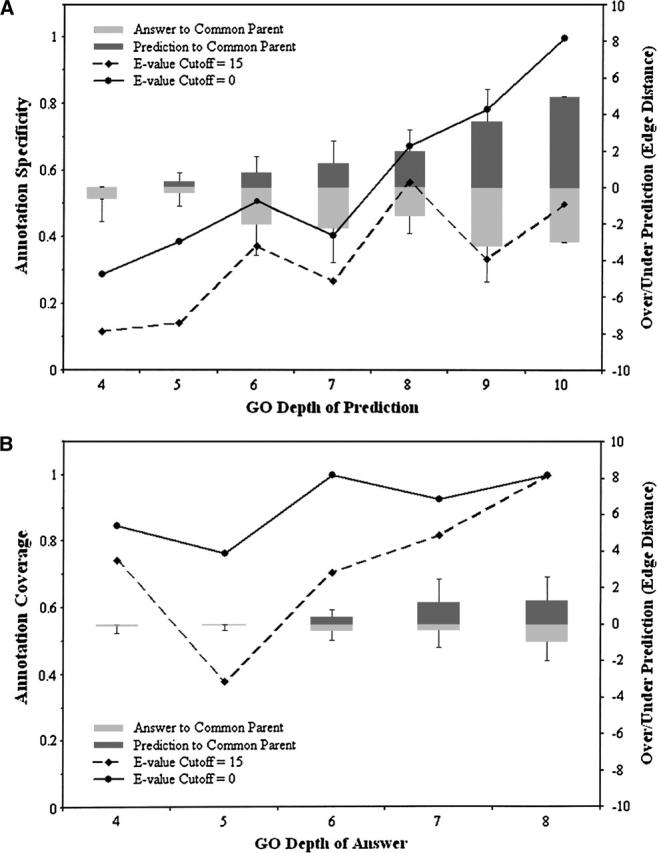
The impetus for the recent development and emergence of automated function prediction methods is an exponentially growing flood of new experimental data, the interpretation of which is hindered by a shortage of reliable annotations for proteins that lack experimental characterization or significant homologs in current databases. Here we introduce PFP, an automated function prediction server that provides the most probable annotations for a query sequence in each of the three branches of the Gene Ontology: biological process, molecular function, and cellular component. Rather than utilizing precise pattern matching to identify functional motifs in the sequences and structures of these proteins, we designed PFP to increase the coverage of function annotation by lowering resolution of predictions when a detailed function is not predictable. To do this we extend a traditional PSI-BLAST search by extracting and scoring annotations (GO terms) individually, including annotations from distantly related sequences, and applying a novel data mining tool, the Function Association Matrix, to score strongly associated pairs of annotations. We show that PFP can correctly assign function using only weakly similar sequences with a significantly better accuracy and coverage than a standard PSI-BLAST search, improving it more than fivefold. The most descriptive annotations predicted by PFP (GO depth > or = 8) can identify a significant subgraph in the GO with > 60% accuracy and approximately 100% coverage for our benchmark set. We also provide examples of the superb performance of PFP in an assessment of automated function prediction servers at the Automated Function Prediction Special Interest Group meeting at ISMB 2005 (AFP-SIG '05).
Figures
References
-
- Altschul S.F., Gish W., Miller W., Myers E.W., Lipman D.J. 1990. Basic local alignment search tool. J. Mol. Biol. 215 403–410. - PubMed
-
- Hawkins T. and Kihara D. 2005a. PFP: Automatic annotation of protein function by relative GO association in multiple functional contexts. The 13th Annual International Conference on Intelligent Systems for Molecular Biology. Detroit, MI. –117.
-
- Hawkins T. and Kihara D. 2005b. The use of context-based functional association in automated protein function prediction methods. The 13th Annual International Conference on Intelligent Systems for Molecular Biology, Automatic Function Prediction—Special Interest Group. Detroit, MI. pp. 16–17.
Publication types
MeSH terms
Substances
Grants and funding
LinkOut - more resources
Full Text Sources
Research Materials
