. 2006 May 16;103(20):7700-5.
doi: 10.1073/pnas.0510944103. Epub 2006 May 3.

Elimination of damaged proteins during differentiation of embryonic stem cells

Affiliations

Elimination of damaged proteins during differentiation of embryonic stem cells

Malin Hernebring et al. Proc Natl Acad Sci U S A. .

Abstract

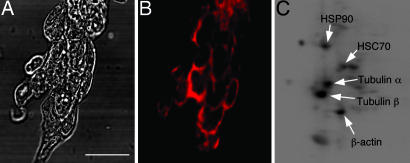
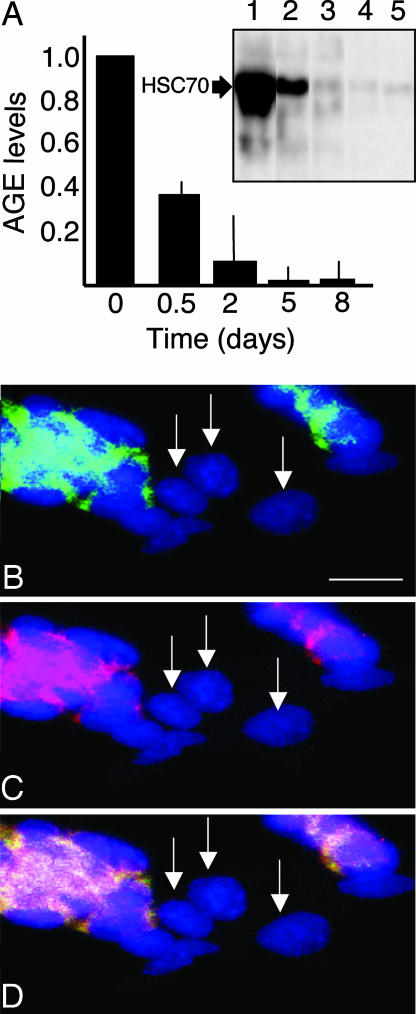
During mammalian aging, cellular proteins become increasingly damaged: for example, by carbonylation and formation of advanced glycation end products (AGEs). The means to ensure that offspring are born without such damage are unknown. Unexpectedly, we found that undifferentiated mouse ES cells contain high levels of both carbonyls and AGEs. The damaged proteins, identified as chaperones and proteins of the cytoskeleton, are the main targets for protein oxidation in aged tissues. However, the mouse ES cells rid themselves of such damage upon differentiation in vitro. This elimination of damaged proteins coincides with a considerably elevated activity of the 20S proteasome. Moreover, damaged proteins were primarily observed in the inner cell mass of blastocysts, whereas the cells that had embarked on differentiation into the trophectoderm displayed drastically reduced levels of protein damage. Thus, the elimination of protein damage occurs also during normal embryonic development in vivo. This clear-out of damaged proteins may be a part of a previously unknown rejuvenation process at the protein level that occurs at a distinct stage during early embryonic development.


Conflict of interest statement

Conflict of interest statement: No conflicts declared.

Figures

Fig. 1.
Fig. 1.
Protein carbonyls in ES cells. (A and B) Bright-field image of fixed ES cells (A) and the corresponding image of carbonyls (B) visualized immunohistochemically. (Scale bar, 25 μm.) (C) Detection of the major targets for carbonylation in undifferentiated ES cells by two-dimensional Western blot analysis. The targets identified included the chaperones HSP90, HSC70, and GR75, as well as the α- and β-chains of tubulin and β-actin (GR75 was not observed in TCA-precipitated proteins samples).
Fig. 2.
Fig. 2.
In situ immunohistochemical detection of carbonylated proteins in undifferentiated (SSEA-1 positive) and differentiated (SSEA-1 negative) murine ES cells. (A) DAPI staining for localization of DNA/nucleus. (B) Immunodetection of SSEA-1 to score for differentiated and undifferentiated cells. (C) Detection of protein carbonyls. (D) Overlay of DAPI and protein carbonyl signals. (E) Overlay of DAPI, SSEA-1, and protein carbonyl signals. In AE, the arrows indicate a cell conglomerate that has embarked on differentiation. (Scale bar, 25 μm.) (F) Expanded view of the boxed area in E showing localization of protein carbonyls between the cell surface (SSEA-1 signal) and the nucleus (DAPI signal) in undifferentiated ES cells. Representative images are shown.
Fig. 3.
Fig. 3.
Levels of protein carbonyls in protein extracts of ES cells upon differentiation. (A) Protein carbonyl levels in undifferentiated ES cells and in cells in which differentiation has been induced by withdrawing LIF. The values are related to those of undifferentiated cells (day 0), which were assigned a value of 1.0. Inset shows Western-blot carbonylation patterns after 0 (lane 1), 0.5 (lane 2), 2 (lane 3), 5 (lane 4), and 8 (lane 5) days of differentiation. (B) Carbonyl levels during differentiation of ES cells, in the absence and presence of LIF, into EBs and RA-induced differentiation into neuronal and/or visceral cells. (C) The overall concentration of the proteins identified as main carbonyl targets in differentiated and undifferentiated ES cells. The concentration is expressed as the ratio of protein levels in undifferentiated cells to those of differentiated ones. Error bars represent standard error of at least three measurements.
Fig. 4.
Fig. 4.
AGE modification in undifferentiated and differentiated ES cells. (A) AGE levels in undifferentiated ES cells (day 0) and cells that have been triggered to differentiate by the removal of LIF. Inset shows a Western blot demonstrating an almost exclusive AGE modification of one single protein, which was identified as HSC70. AGE modification of HSC70 is shown after 0 (lane 1), 0.5 (lane 2), 2 (lane 3), 5 (lane 4), and 8 (lane 5) days of differentiation. Error bars represent standard error of at least three measurements. (B) Overlay of AGE immunodetection (green) and DAPI (blue) signals. (C) Overlay of carbonyl (red) and DAPI signals. (D) Overlay of AGE, carbonyl, and DAPI signals. In BD, arrows indicate cells that are negative for both carbonyl and AGE staining. Representative images are shown. (Scale bar, 25 μm.)
Fig. 5.
Fig. 5.
20S proteasome activity in undifferentiated ES cells and cells that have been triggered to differentiate by the removal of LIF. The chemotryptic activity of the proteasome was assayed by hydrolysis of the fluorogenic peptide succinyl-Leu-Leu-Val-Tyr-7-amino-4-methylcoumarin. The activities were all related to the activity obtained for the undifferentiated cells, which was assigned a value of 1.0. Day 0 denotes the undifferentiated ES cells, and “3” and “5” indicate 3 and 5 days of differentiation after the removal of LIF, respectively. Error bars represent standard deviation of three measurements in triplicate from three independent ES cell cultures.
Fig. 6.
Fig. 6.
Protein damage in the undifferentiated cells of the inner cell mass in mouse blastocysts. (AD) Series 1. (A) DAPI signal. (B) SSEA-1 signal. (C) Carbonyl signal. (D) Overlay of DAPI, SSEA-1, and carbonyl signals. (EG) Series 2. (E) DAPI signal. (F) AGE immunodetection. (G) DAPI and AGE costaining. Arrows indicate the inner cell mass. A total of eight blastocysts were stained, and representative images are shown. (Scale bars, 25 μm.)

References

    1. Lombard D. B., Chua K. F., Mostoslavsky R., Franco S., Gostissa M., Alt F. W. Cell. 2005;120:497–512. - PubMed
    1. Medvedev Z. A. Mech. Ageing Dev. 1981;4:331–359. - PubMed
    1. Stadtman E. R. Science. 1992;257:1220–1224. - PubMed
    1. Levine R. L. Free Radical Biol. Med. 2002;32:790–796. - PubMed
    1. Bota D. A., Davies K. J. Nat. Cell Biol. 2002;4:674–680. - PubMed

Publication types