

Microeukaryote community patterns along an O2/H2S gradient in a supersulfidic anoxic fjord (Framvaren, Norway)
- PMID: 16672511
- PMCID: PMC1472314
- DOI: 10.1128/AEM.72.5.3626-3636.2006
Microeukaryote community patterns along an O2/H2S gradient in a supersulfidic anoxic fjord (Framvaren, Norway)
Abstract
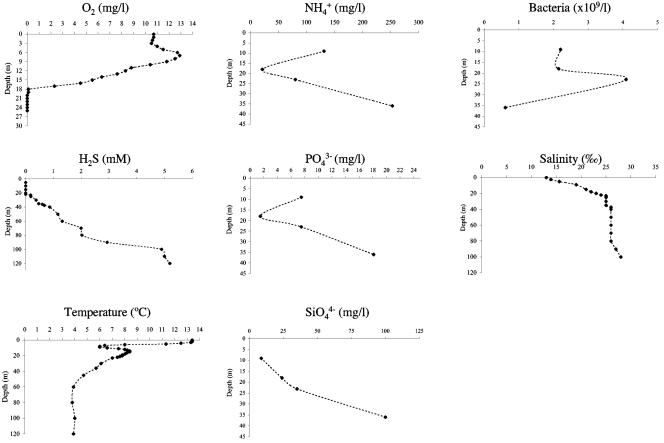
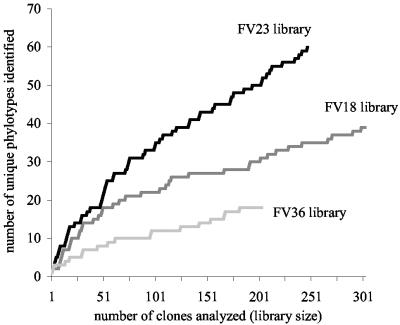
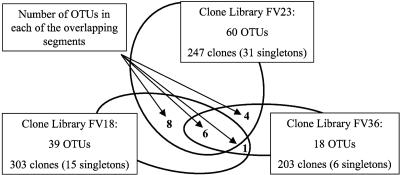
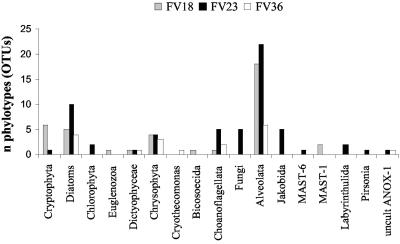
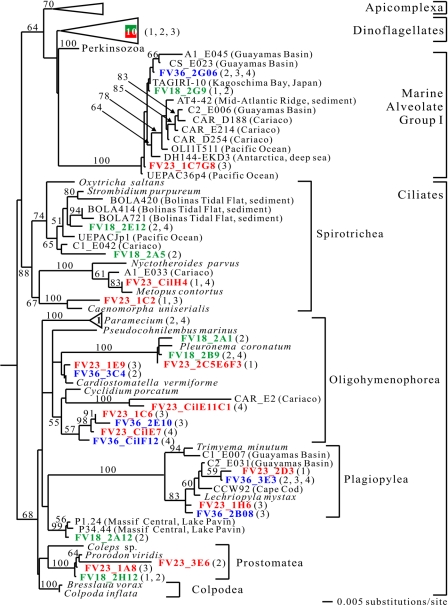
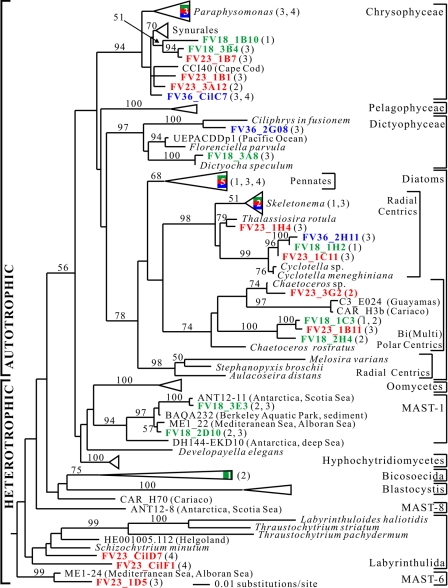
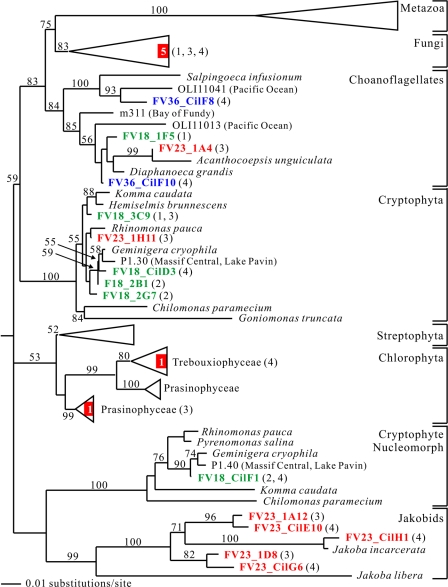
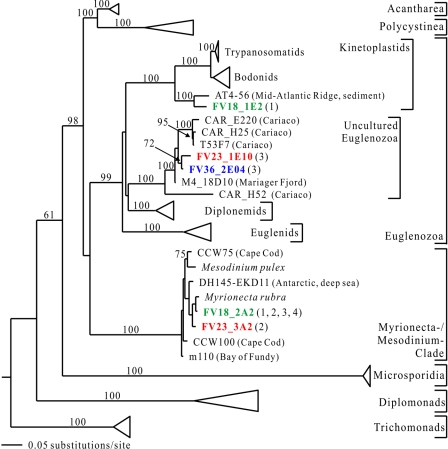
To resolve the fine-scale architecture of anoxic protistan communities, we conducted a cultivation-independent 18S rRNA survey in the superanoxic Framvaren Fjord in Norway. We generated three clone libraries along the steep O(2)/H(2)S gradient, using the multiple-primer approach. Of 1,100 clones analyzed, 753 proved to be high-quality protistan target sequences. These sequences were grouped into 92 phylotypes, which displayed high protistan diversity in the fjord (17 major eukaryotic phyla). Only a few were closely related to known taxa. Several sequences were dissimilar to all previously described sequences and occupied a basal position in the inferred phylogenies, suggesting that the sequences recovered were derived from novel, deeply divergent eukaryotes. We detected sequence clades with evolutionary importance (for example, clades in the euglenozoa) and clades that seem to be specifically adapted to anoxic environments, challenging the hypothesis that the global dispersal of protists is uniform. Moreover, with the detection of clones affiliated with jakobid flagellates, we present evidence that primitive descendants of early eukaryotes are present in this anoxic environment. To estimate sample coverage and phylotype richness, we used parametric and nonparametric statistical methods. The results show that although our data set is one of the largest published inventories, our sample missed a substantial proportion of the protistan diversity. Nevertheless, statistical and phylogenetic analyses of the three libraries revealed the fine-scale architecture of anoxic protistan communities, which may exhibit adaptation to different environmental conditions along the O(2)/H(2)S gradient.
Figures
References
-
- Acinas, S. G., V. Klepac-Ceraj, D. E. Hunt, C. Pharino, I. Ceraj, D. L. Distel, and M. F. Polz. 2004. Fine-scale phylogenetic architecture of a complex bacterial community. Nature 430:551-554. - PubMed
-
- Amaral-Zettler, L. A., F. Gómez, E. Zettler, B. G. Keenan, R. Amils, and M. L. Sogin. 2002. Eukaryotic diversity in Spain's River of Fire. Nature 417:137. - PubMed
-
- Baldauf, S. L., D. Bhattacharya, J. Cockrill, P. Hugenholtz, J. Pawlowski, and G. B. Simpson. 2004. The tree of life: an overview, p. 43-75. In J. Cracraft and M. J. Donoghue (ed.), Assembling the tree of life. Oxford University Press, Oxford, United Kingdom.
Publication types
MeSH terms
Substances
Associated data
- Actions
- Actions
- Actions
- Actions
- Actions
- Actions
- Actions
- Actions
- Actions
- Actions
- Actions
- Actions
- Actions
- Actions
- Actions
- Actions
- Actions
- Actions
- Actions
- Actions
- Actions
- Actions
- Actions
- Actions
- Actions
- Actions
- Actions
- Actions
- Actions
- Actions
- Actions
- Actions
- Actions
- Actions
- Actions
- Actions
- Actions
- Actions
- Actions
- Actions
- Actions
- Actions
- Actions
- Actions
- Actions
- Actions
- Actions
- Actions
- Actions
- Actions
- Actions
- Actions
- Actions
- Actions
- Actions
- Actions
- Actions
- Actions
- Actions
- Actions
- Actions
- Actions
- Actions
- Actions
- Actions
- Actions
- Actions
- Actions
- Actions
- Actions
- Actions
- Actions
- Actions
- Actions
- Actions
- Actions
- Actions
- Actions
- Actions
- Actions
- Actions
- Actions
- Actions
- Actions
- Actions
- Actions
- Actions
- Actions
- Actions
- Actions
- Actions
- Actions
- Actions
- Actions
- Actions
- Actions
- Actions
- Actions
- Actions
- Actions
- Actions
- Actions
- Actions
- Actions
- Actions
- Actions
- Actions
- Actions
- Actions
- Actions
- Actions
- Actions
- Actions
- Actions
- Actions
- Actions
- Actions
- Actions
- Actions
- Actions
- Actions
- Actions
- Actions
- Actions
- Actions
- Actions
- Actions
- Actions
- Actions
- Actions
- Actions
- Actions
- Actions
- Actions
- Actions
- Actions
- Actions
- Actions
- Actions
- Actions
- Actions
- Actions
- Actions
- Actions
- Actions
- Actions
- Actions
- Actions
- Actions
- Actions
- Actions
- Actions
- Actions
- Actions
- Actions
- Actions
- Actions
- Actions
- Actions
- Actions
- Actions
- Actions
- Actions
- Actions
- Actions
- Actions
- Actions
- Actions
- Actions
- Actions
- Actions
- Actions
- Actions
- Actions
- Actions
- Actions
- Actions
- Actions
- Actions
- Actions
- Actions
- Actions
- Actions
LinkOut - more resources
Full Text Sources
Molecular Biology Databases
