. 2006 May;188(10):3600-13.
doi: 10.1128/JB.188.10.3600-3613.2006.

Transcriptome and phenotypic responses of Vibrio cholerae to increased cyclic di-GMP level

Affiliations

Transcriptome and phenotypic responses of Vibrio cholerae to increased cyclic di-GMP level

Sinem Beyhan et al. J Bacteriol. 2006 May.

Abstract

Vibrio cholerae, the causative agent of cholera, is a facultative human pathogen with intestinal and aquatic life cycles. The capacity of V. cholerae to recognize and respond to fluctuating parameters in its environment is critical to its survival. In many microorganisms, the second messenger, 3',5'-cyclic diguanylic acid (c-di-GMP), is believed to be important for integrating environmental stimuli that affect cell physiology. Sequence analysis of the V. cholerae genome has revealed an abundance of genes encoding proteins with either GGDEF domains, EAL domains, or both, which are predicted to modulate cellular c-di-GMP concentrations. To elucidate the cellular processes controlled by c-di-GMP, whole-genome transcriptome responses of the El Tor and classical V. cholerae biotypes to increased c-di-GMP concentrations were determined. The results suggest that V. cholerae responds to an elevated level of c-di-GMP by increasing the transcription of the vps, eps, and msh genes and decreasing that of flagellar genes. The functions of other c-di-GMP-regulated genes in V. cholerae are yet to be identified.


Figures

FIG. 1.
FIG. 1.
Modulation of the c-di-GMP level using an inducible system. Analysis of total nucleotides from (A) uninduced and (B) arabinose-induced E-DGC cultures. Nucleotides were extracted from E-DGC grown in MOPS medium with [32P]orthophosphate, spotted on TLC plates (lower left corner), and developed in 0.2 M NH4HCO3 (pH 7.8), in the first dimension (bottom to top of plate) and 1.5 M KH2PO4 (pH 3.65), in the second dimension (left to right of plate). The white arrow indicates the spot corresponding to c-di-GMP. (C) Quantification of c-di-GMP. Amounts of c-di-GMP and GDP were quantified using ImageQuant. The c-di-GMP/GDP ratio was used as an indication of the change in c-di-GMP concentration.
FIG. 2.
FIG. 2.
Functional categories of differentially expressed genes in response to an increased c-di-GMP level. The number of genes whose expression is induced or repressed in response to the increased c-di-GMP level is presented according to the functions assigned to them by The Institute for Genomic Research.
FIG. 3.
FIG. 3.
Expression of vps, eps, and msh genes and biofilm-forming capacity are modulated by the c-di-GMP level. (A) Expression profiles of vsp, msh, and eps genes. Differences in the abundance of transcripts between the E-DGC and E-pBAD33 strains and the C-DGC and C-pBAD33 strains are presented by using the color scale shown at the bottom of the panels (red, induced; green, repressed). Differentially regulated genes were identified by SAM analysis using a 1.3-fold change and an FDR of ≤1% as criteria. (B and C) Quantitative analysis of biofilm formation in LB (B) and in MOPS (C). Biofilm phenotypes of E-pBAD33, E-DGC and E-PDEA in the presence (+) and absence (−) of 0.2% arabinose are presented. Biofilms were formed under static conditions at 30°C. After 2, 4, 6, and 12 h of incubation, attached bacteria were stained with crystal violet, and the staining intensity was determined by absorbance of ethanol solubilized biofilms at 595 nm. Error bars indicate standard deviations.
FIG. 4.
FIG. 4.
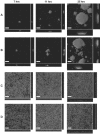
Biofilm development dynamics are altered in response to changes in c-di-GMP level. Biofilm structures of E-DGC in the absence (A) and presence (B) of 0.2% arabinose are shown. Biofilms were grown in flow chambers, and images were acquired with confocal laser scanning microscopy. Top-down and orthogonal views of biofilms are given in large panels and side panels, respectively. Bar, 30 μm.
FIG. 5.
FIG. 5.
Biofilm development dynamics of mshA and vpsI deletion mutants are not altered in response to changes in the c-di-GMP level. Biofilm structures of SΔmshA and SΔvpsI strains in the absence (A and C) and presence (B and D) of 0.2% arabinose are shown. Biofilms were grown in flow chambers, and images were acquired with confocal laser scanning microscopy. Top-down and orthogonal views of biofilms are given in large panels and side panels, respectively. Bar, 30 μm.
FIG. 6.
FIG. 6.
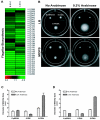
C-di-GMP modulates motility behavior. (A) Expression profile of flagellum biosynthesis genes in E-DGC and C-DGC after 30 min of DGC induction compared to E-pBAD33 and C-pBAD33, respectively. Genes were identified by SAM analysis using a 1.3-fold change and an FDR of ≤1% as criteria. Expression ratios of significant genes are presented according to the color scheme shown at the bottom of the panel. (B) Motility phenotypes of E-pBAD33, E-DGC, and E-PDEA on LB and MOPS soft agar plates containing chloramphenicol with or without arabinose. The diameters of the motility zones of E-pBAD33, E-DGC, and E-PDEA were measured after 20 and 48 h of incubation at 30°C for LB- and MOPS-grown cells, respectively. (C and D) Changes in the diameters of the motility zones in the absence and presence of induction on LB (C) and MOPS (D) soft agar plates.
FIG. 7.
FIG. 7.
Analysis of temporal transcriptome responses to c-di-GMP. Comparison of gene expression profiles of E-DGC after 15 and 30 min of DGC induction. Plot area is divided into four regions (I through IV) based on the expression patterns before and after induction. Black triangles indicate genes that were differentially expressed (change of at least twofold; FDR, ≤1%) only at 15 min, orange triangles indicate genes that were differentially expressed only at 30 min, and purple circles indicate genes that were differentially expressed at both time points.

References

    1. Ali, A., J. A. Johnson, A. A. Franco, D. J. Metzger, T. D. Connell, J. G. Morris, Jr., and S. Sozhamannan. 2000. Mutations in the extracellular protein secretion pathway genes (eps) interfere with rugose polysaccharide production in and motility of Vibrio cholerae. Infect. Immun. 68:1967-1974. - PMC - PubMed
    1. Bao, Y., D. P. Lies, H. Fu, and G. P. Roberts. 1991. An improved Tn7-based system for the single-copy insertion of cloned genes into chromosomes of gram-negative bacteria. Gene 109:167-168. - PubMed
    1. Bobrov, A. G., O. Kirillina, and R. D. Perry. 2005. The phosphodiesterase activity of the HmsP EAL domain is required for negative regulation of biofilm formation in Yersinia pestis. FEMS Microbiol. Lett. 247:123-130. - PubMed
    1. Bomchil, N., P. Watnick, and R. Kolter. 2003. Identification and characterization of a Vibrio cholerae gene, mbaA, involved in maintenance of biofilm architecture. J. Bacteriol. 185:1384-1390. - PMC - PubMed
    1. Camilli, A., and J. J. Mekalanos. 1995. Use of recombinase gene fusions to identify Vibrio cholerae genes induced during infection. Mol. Microbiol. 18:671-683. - PMC - PubMed

Publication types

Substances

LinkOut - more resources