. 2006 May 5;312(5774):754-8.
doi: 10.1126/science.1123721.

Neurobiological substrates of dread

Affiliations

Neurobiological substrates of dread

Gregory S Berns et al. Science. .

Abstract

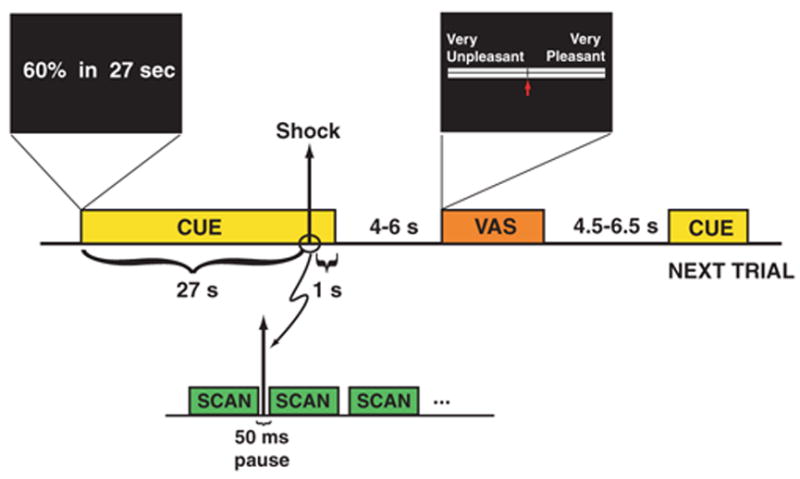
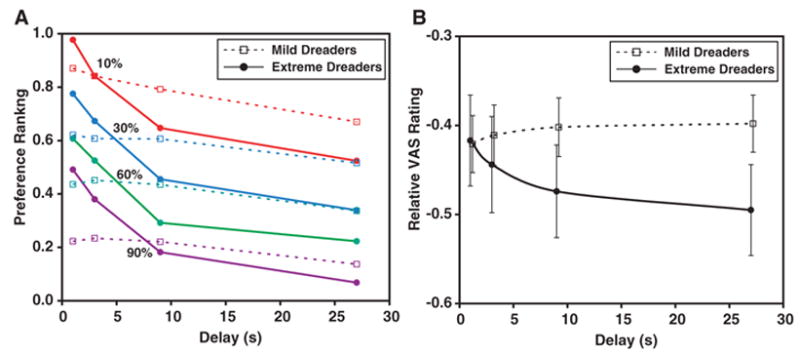
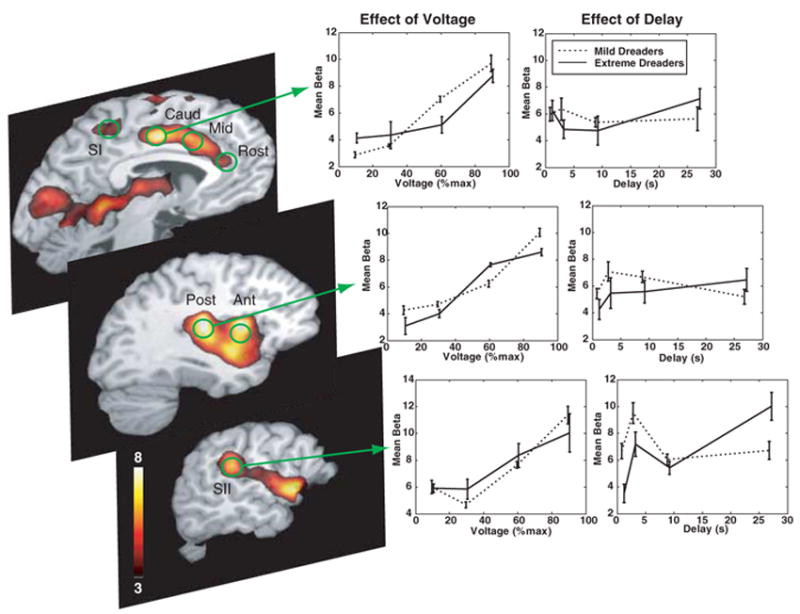
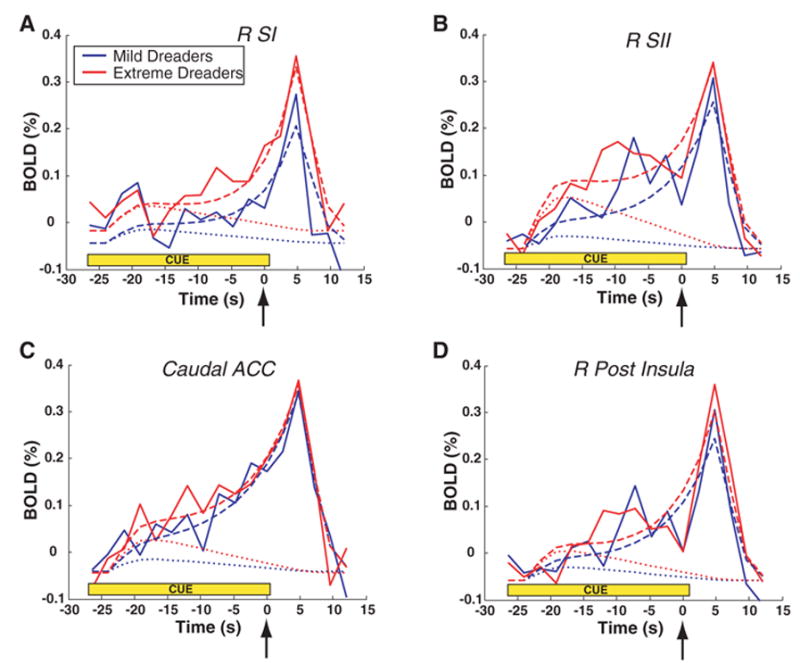
Given the choice of waiting for an adverse outcome or getting it over with quickly, many people choose the latter. Theoretical models of decision-making have assumed that this occurs because there is a cost to waiting-i.e., dread. Using functional magnetic resonance imaging, we measured the neural responses to waiting for a cutaneous electric shock. Some individuals dreaded the outcome so much that, when given a choice, they preferred to receive more voltage rather than wait. Even when no decision was required, these extreme dreaders were distinguishable from those who dreaded mildly by the rate of increase of neural activity in the posterior elements of the cortical pain matrix. This suggests that dread derives, in part, from the attention devoted to the expected physical response and not simply from fear or anxiety. Although these differences were observed during a passive waiting procedure, they correlated with individual behavior in a subsequent choice paradigm, providing evidence for a neurobiological link between the experienced disutility of dread and subsequent decisions about unpleasant outcomes.


Figures

Fig. 1
Fig. 1
Functional MRI trial design. Each trial followed a delay-conditioning procedure, in which a cue was presented for the duration of the trial, up to and beyond the delivery of an aversive stimulus in the form of a brief cutaneous electric shock (10 to 15 ms in duration). At the beginning of each trial, a cue was displayed that indicated the level of shock (expressed as a percentage of the individual’s maximum tolerable voltage) and the time until that shock would be delivered. Four voltage levels [10, 30, 60 (shown), and 90%] and four time delays [1, 3, 9, and 27 s (shown)] were used in all 16 possible combinations. To avoid shock-induced artifacts on the fMRI images, a 50-ms pause between scan volumes was introduced, and each shock was delivered during this pause. Following the shock, the cue remained visible for another 1 s to prevent conditioning to the cue offset. A visual analog scale (VAS) was then presented in which the individual moved an arrow to indicate their subjective experience for the entire preceding trial, including the waiting time.
Fig. 2
Fig. 2
Ratings of aversive experience. (A) Ratings, as a function of voltage and delay, obtained by forced-choice preference procedure after the fMRI session. Participants were offered a series of choice pairs in which they had to choose between different voltage and delay combinations. An ordinal ranking was computed based on these choices (0 is worst and 1 is best), and participants were categorized as either ‘‘mild dreaders’’ (prefer to receive shock as soon as possible, but not so much as to take more voltage to do so) and ‘‘extreme dreaders’’ (really dislike waiting, as evidenced by choosing more voltage to receive the shock quickly). There was a significant effect on preference by both voltage [F(3,90) = 709.9, P < 0.0001] and delay [F(3,90) = 32.4, P < 0.0001] as well as the interaction of group (mild versus extreme dreader) and delay [F(3,90) = 12.0, P < 0.0001]. (B) Visual analog scale (VAS) ratings as a function of delay, normalized to each individual’s minimum rating (–1 is the worst rating and 0 is neutral) and averaged across the four voltage levels. Error bars show SEM across participants. There was a significant interaction between group and delay [repeated measures analysis of variance: F(3,90) = 4.4, P = 0.007], with the extreme dreaders indicating that the shock experience after a longer delay was significantly worse than the equivalent voltage at a shorter delay. This was not the case for the mild dreaders.
Fig. 3
Fig. 3
Effect of voltage and delay on the brain response to the shock itself. Statistical parametric map of the voltage-sensitive response to shock (left), identified by a linearly weighted contrast across the four voltage levels (P < 0.001, uncorrected). ROIs (green) were defined on the basis of this functional map in conjunction with anatomical masks within the cortical pain matrix (): SI for the foot, SII (, ), anterior (Ant) and posterior (Post) insular cortex, caudal ACC (Caud), middle ACC (Mid), rostral ACC (Rost), and amygdala (not shown). There was a significant positive effect of voltage on the amplitude of response to the shock itself in all of the ROIs (middle, shown for caudal ACC, right posterior insula, and right SII), and this was not significantly different for the mild and extreme dreaders. With the possible exception of the right SII, the length of the preceding delay had minimal, if any, effect on the response to the shock itself (right) and was not significantly different between mild and extreme dreaders (). The trials with 1-s and 3-s delays, however, did not allow complete separation of the cue response from the shock response, and so these beta values are not exactly equivalent to the 9-s and 27-s values. The general lack of an effect of delay on the instantaneous response to the shock itself suggested that the utility of the outcome was not affected by how long one had to wait for it. Given this evidence, the differentiation of mild and extreme dreaders must have occurred during the waiting period (Fig. 4).
Fig. 4
Fig. 4
Flow of dread in selected brain regions while waiting for shocks. Solid lines were averaged from 60 and 90% voltage trials (27-s trials only) in mild dreaders (solid blue) and extreme dreaders (solid red). The trial began with the cue at t = –27 s, and the shock occurred at t = 0 (arrow). During the waiting period (cue), the extreme dreaders displayed earlier and more sustained activity increases than the mild dreaders. BOLD, blood oxygenation level–dependent response as percentage change from baseline. To determine whether these differences were based predominately in an early prospective response or a later anticipation of consumption, a theoretical model of waiting was fit to the data (dashed lines). This model was comprised of two terms that were convolved with a hemodynamic response function: a declining dread term (dotted lines) and an exponentially increasing time-discounted consumption term (not shown for clarity). The dread term was calculated as the forward-looking integral from time t to the shock (i.e., –α t), which has the characteristic of being maximal at the beginning of the trial and decreasing linearly to zero at the time of the shock. Significantly positive values for the dread factor α are associated with the experience of disutility from waiting itself. The four ROIs that had significantly greater (P ≤ 0.001) dread factors in the extreme dreaders compared with those of the mild dreaders were (A) the right SI; (B) the right SII; (C) the caudal ACC; and (D) the right posterior insula. The difference between mild and extreme dreaders is seen most clearly by the early increase in activity, especially in the right SII and the caudal ACC and noted by the difference between the two dotted lines.

Comment in

References

    1. Samuelson PA. Rev Econ Stud. 1937;4:155.
    1. The opposite of utility is generally referred to as disutility, but for the sake of clarity, we refer to ‘‘utility’’ as possessing both positive and negative domains.
    1. Loewenstein G. Econ J. 1987;97:666.
    1. Caplin A, Leahy J. Q J Econ. 2001;116:55.
    1. Ji RR, Kohno T, Moore KA, Woolf CJ. Trends Neurosci. 2003;26:696. - PubMed

Publication types