. 2006 Jun 7;25(11):2584-95.
doi: 10.1038/sj.emboj.7601127. Epub 2006 May 4.

Apoptosis regulation in tetraploid cancer cells

Affiliations

Apoptosis regulation in tetraploid cancer cells

Maria Castedo et al. EMBO J. .

Abstract

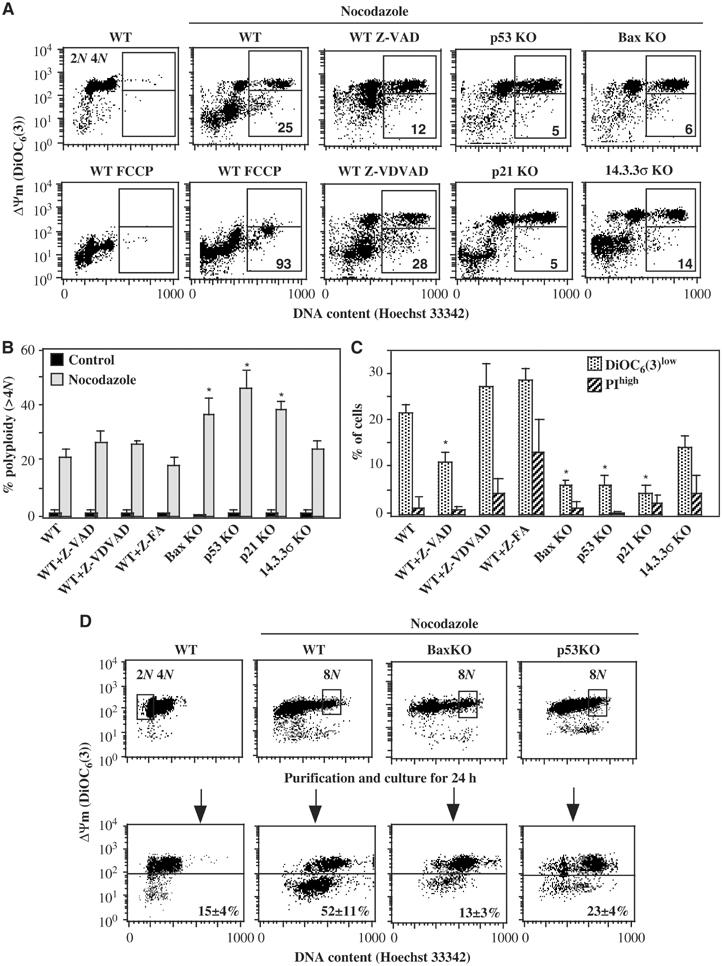
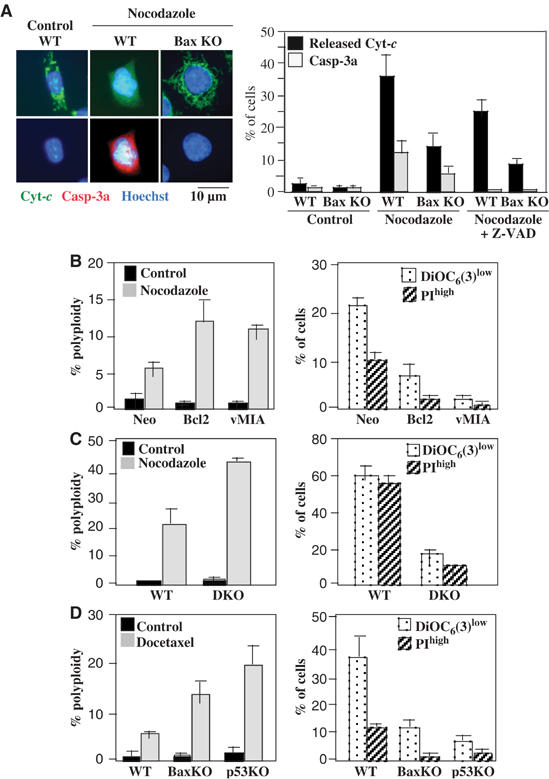
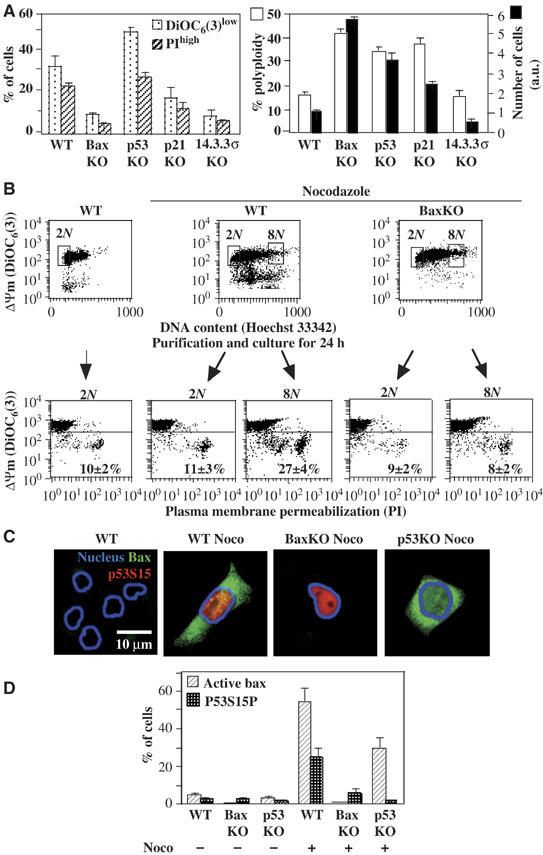
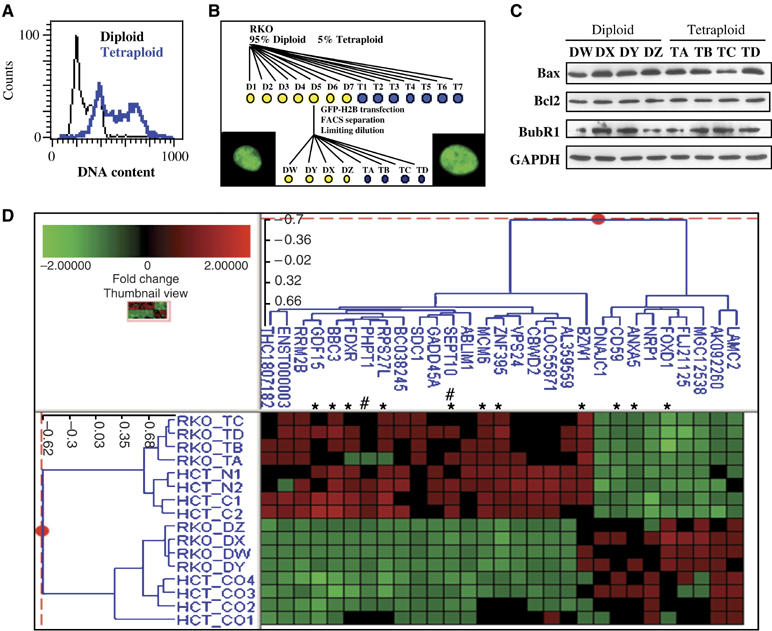
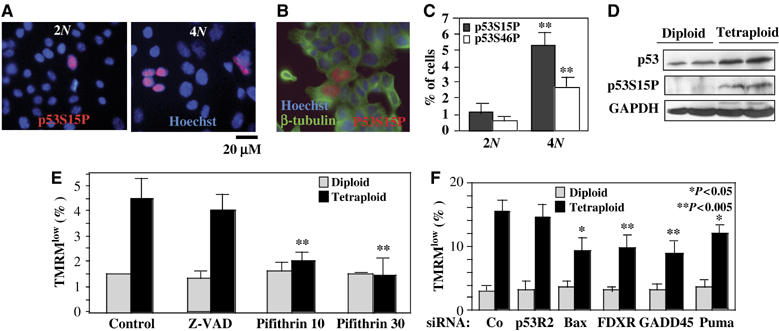
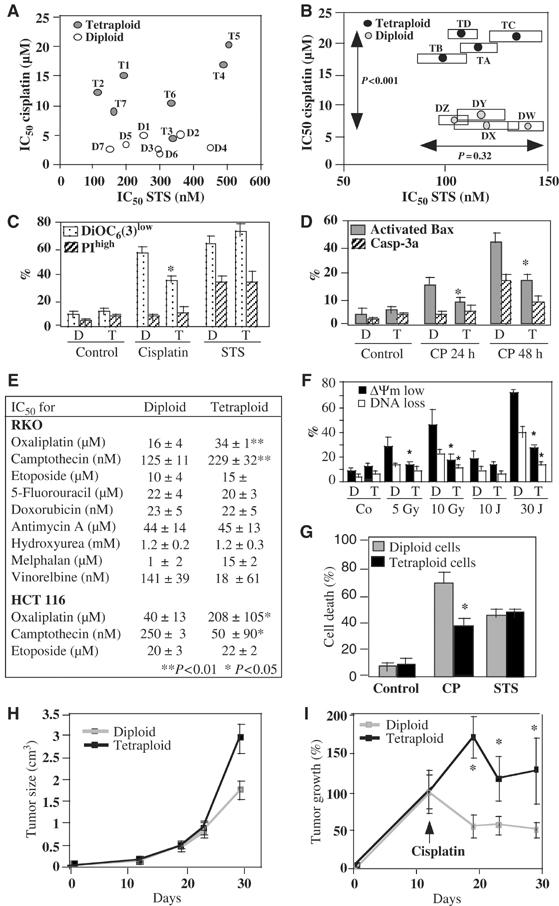
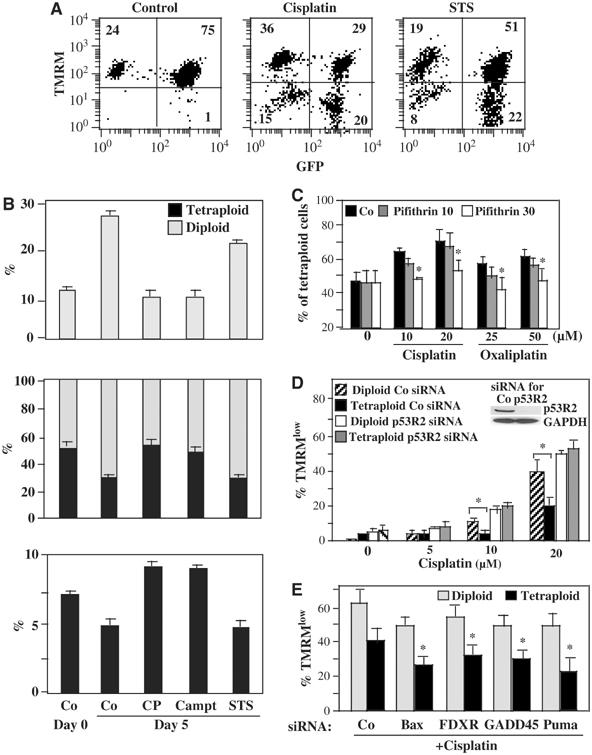
Tetraploidy can result in cancer-associated aneuploidy. As shown here, freshly generated tetraploid cells arising due to mitotic slippage or failed cytokinesis are prone to undergo Bax-dependent mitochondrial membrane permeabilization and subsequent apoptosis. Knockout of Bax or overexpression of Bcl-2 facilitated the survival of tetraploid cells at least as efficiently as the p53 or p21 knockout. When tetraploid cells were derived from diploid p53 and Bax-proficient precursors, such cells exhibited an enhanced transcription of p53 target genes. Tetraploid cells exhibited an enhanced rate of spontaneous apoptosis that could be suppressed by inhibition of p53 or by knockdown of proapoptotic p53 target genes such as BBC3/Puma, GADD45A and ferredoxin reductase. Unexpectedly, tetraploid cells were more resistant to DNA damaging agents (cisplatin, oxaliplatin and camptothecin) than their diploid counterparts, and this difference disappeared upon inhibition of p53 or knockdown of p53-inducible ribonucleotide reductase. Tetraploid cells were also more resistant against UVC and gamma-irradiation. These data indicate the existence of p53-dependent alterations in apoptosis regulation in tetraploid cells.


Figures

Figure 1
Figure 1
Acute mortality of polyploid cells modulated by p53 and Bax. Wild-type (WT) HCT116 cells or cells manipulated to lose expression of p53, p21, 14.3.3σ or Bax were cultured in the absence or presence of nocodazole, alone or combined with the protonophore FCCP (which dissipates the ΔΨm) or the protease inhibitors Z-VAD-fmk, Z-VDVAD-CHO or Z-FA-fmk for 48 h, followed by three-color staining with Hoechst 33342 (which measures DNA content), DiOC6(3) (which measures ΔΨm) and propidium iodine (PI, a vital dye that incorporates only into dead cells) and cytofluorometric evaluation. (A) Representative pictograms showing the polyploid cells (DNA content >4N) with a normal ΔΨm (upper window), as well as polyploid cells with reduced ΔΨm (lower window). Numbers refer to the percentage of polyploid DiOC6(3)low cells (considering 100% as the sum of all polyploid cells). (B) Percentage of polyploid cells among the total population of cells treated as in (A). (C) Frequency of dying (DiOC6(3)low) and dead (PIhigh) cells among the polyploid population elicited by nocodazole, as determined by FACS analysis. Values are X±s.e.m. of five independent experiments. Asterisks refer to significant effects (paired Student's t-test, P<0.001). (D) Fate of viable polyploid cells elicited by nocodazole. Cells with the indicated genotype were cultured for 30 h in the absence or presence of nocodazole and then stained with Hoechst 33342 and DiOC6(3), followed by FACS purification of the euploid (2N) or polyploidy (>4N) DiOC6(3)high cells (as indicated by the windows in the upper panels). These purified cells were then cultured for 24 h and reanalyzed after restaining with Hoechst 33342 and DiOC6(3), as indicated in the lower panels. Numbers indicate the percentage of cells with a DiOC6(3)low phenotype (X±s.e.m., n=3).
Figure 2
Figure 2
Mitochondrial cell death regulators and the fate of polyploid cells. (A) Evidence for MOMP in nocodazole-treated cells. Untreated control or nocodazole treated HCT116 cells (either wild type or Bax KO) were treated for 48 h with nocodazole alone or in combination with Z-VAD-fmk, followed by confocal immunofluorescence staining with antibodies specific for cytochrome c (Cyt c) and proteolytically active caspase-3 (Casp-3a). The percentage of cells exhibiting diffuse Cyt c staining or positivity for Casp-3a was determined among the entire population in controls and among nocodazole treated cells that exhibited a larger nucleus than controls, and that were considered as polyploid (X±s.e.m., n=3). (B) Effect of Bcl-2 overexpression and vMIA expression on the fate of polyploid cells. HeLa cells transfected with Bcl-2 or vMIA were treated for 48 h with nocodazole. Then, the frequency (X±s.e.m., n=4) of polyploid cells among the total population (left panels) or that of dying (DiOC6(3)low) and dead (PIhigh) cells among the polyploid population elicited by nocodazole (right panels) was determined as in Figure 1A–C. (C) Comparison of wild-type or Bax−/−Bak−/− DKO MEF in their response to nocodazole. Cells were treated and monitored as in (B). (D) Effect of the Bax and p53 knockout on docetaxel-induced polyploidization. HCT116 cells with the indicated genotype were treated for 48 h with 100 nM docetaxel and the frequency (X±s.e.m., n=4) of polyploid cells among the total population (left panels) or that of dying (DiOC6(3)low) and dead (PIhigh) cells among polyploid cells (right panel) was determined.
Figure 3
Figure 3
Long-term effects of Bax and p53 on the survival of polyploid cells. (A) Chronic mortality of polyploid cells modulated by p53 and Bax. HCT116 cells with the indicated genotype were treated for 48 h with nocodazole, then washed extensively (5 ×) and cultured during further 8 days in normal culture medium, followed by determination of the frequency (X±s.e.m., n=5) of live, dying and dead polyploid cells as in Figure 1A–C. Note that less than 5% of cells with an ∼2N DNA content were dying (DiOC6(3)low) or dead (PIhigh) cells and that dying or dead cells were almost exclusively found in the polyploid (>4N) population. (B) Fate of viable polyploidy cells induced by nocodazole. HCT116 WT or HCT116 BaxKO cells were transiently exposed to nocodazole for 2 days and then cultured for 8 days without nocodazole, stained with DiOC6(3) versus Hoechst 33342 followed by FACS purification of cells with 2N or 8N DNA content, cultured for 24 h and relabelled with DiOC6(3) and PI to determine the frequency of dying and dead cells. (C, D) p53-dependent and -independent Bax activation in a fraction of polyploid cells. HCT116 cells (WT, Bax KO or p53 KO) were cultured for 48 h in nocodazole and then for 8 days without nocodazole, followed by immunofluorescence staining of activated Bax and S15-phosphorylated p53. Representative micrographs are shown in (C), and data are quantified in (D). The percentage of cells exhibiting a punctate cytoplasmic staining for activated Bax or a nuclear staining for S15-phosphorylated p53 was assessed among the entire population in untreated controls and among nocodazole-exposed, polyploid cells (X±s.e.m., n=3).
Figure 4
Figure 4
Establishment and characterization of tetraploid cell lines. (A) Comparison of the DNA content of a representative tetraploid HCT116 cell line and of its diploid control. (B) Genealogy of diploid and tetraploid RKO clones. The wild-type control cell line containing ∼5% tetraploid cells was subcloned by limiting dilution into diploid and tetraploid clones; The D5 clone was transfected with a cDNA encoding an H2B-GFP chimera, FACS-separated into subsets of cells enriched in a diploid or tetraploid DNA content, and again subcloned to generate diploid and tetraploid H2B-GFP-expressing clones. Representative fluorescence micrographs of such cells are shown (the width of the squares is 25 μm). (C) Western blot determination of the expression levels of Bax, Bcl-2, p53 and BubR1, with GAPDH as a loading control. (D) Microarray analyses of the transcriptome of diploid versus tetraploid cells. The clones HCT116 C1 and C2 and N1 and N2 are tetraploid, generated upon cytochalasin D or nocodazole treatment, respectively. Clones Co1–4 are diploid. The RKO clones are described in (B). The overlap between the genes coming from an ANOVA test with a threshold P-value of 10−3 on the HCT116 samples (Supplementary Figure 5S) and the same test on the RKO samples (Supplementary Figure 6S) led to the selection of 29 genes. These genes were subjected to a hierarchical cluster analysis using a calculation based on cosine correlation and the agglomerative method of the average link. Each row represents the combination of two dye-swap experimental samples and each column represents a single accession number. *marks genes that carry at least one consensus p53-binding consensus sequence (RRRCWWGYYY), within the 2000 nucleotides upstream of the transcription start. # marks genes the promoter of which contains putative p53 binding sites, as determined by another procedure bases on a sliding profile of four matrixes of the sequence RRRCA/TT/AGYYY, as detailed in the Materials and methods.
Figure 5
Figure 5
Constitutive p53 activation in tetraploid cells. (A, B) Staining of cells with an antibody recognizing p53 phophorylated on serine 15 (p53S15P). Representative images are shown for diploid and tetraploid RKO populations in (A). In (B), a representative tetraploid cells positive for p53S15P and counterstained with β-tubulin is shown. (C) Frequency of cells with positive nuclear staining for p53S15P or p53 phophorylated on serine 46 (p53S46P) is shown for diploid (n=4) and tetraploid (n=4) RKO cells. Asterisks indicate significant (P<0.01) differences between diploid and tetraploid cells (unpaired Student's t-test). (D) Immunoblot confirmation of the p53 activation. Representative diploid (DW, DY) and tetraploid (TA, TD) cells were subjected to immunoblot detection of p53, p53S15P and GAPDH. (E) Spontaneous cell death in RKO cells and its suppression by cyclic pifithrin-α. Cells were cultured for 2 days in the presence of Z-VAD-fmk or pifithrin-α, and the frequency of dying cells was measured by staining with TMRM. Asterisks indicate significant differences determined by ploidy (P<0.01, Student's t-test, X±s.e.m., n=4). (F) Effect of siRNAs on the spontaneous death of tetraploid RKO cells. Cells were transfected with siRNAs specific for emerin (negative control, Co), ferredoxin reductase (FDXR), GADD45A, Puma, Bax or p53R2 and 72 h later the spontaneous mortality of cells was assessed as in (E). Asterisks in (E) and (F) indicate significant inhibitory effects as compared to control cells (untreated in (E) and Emerin siRNA-transfected in (F)).
Figure 6
Figure 6
Relative resistance of tetraploid cells against DNA-damaging agents. (A, B) Comparison of the IC50 values of cisplatin and staurosporine (STS) for diploid (D) and tetraploid (T) RKO cells (for the codes of cell lines see scheme in Figure 4B). The IC50 was determined by the MTT assay, 48 h after addition of the drugs. Untransfected cells are shown in (A) and cells expressing GFP-H2B are shown in (B). (C, D). Reduced cisplatin-induced apoptosis in tetraploid cells. Four diploid and four tetraploid HCT116 cell lines were exposed to cisplatin (CP) or STS (48 h in C) and trypsinized, followed by staining with DiOC6(3) (which measures ΔΨm) plus propidium iodine (PI) and FACS analysis (C) or were left on the culture support, fixed, permeabilized and stained for the detection of activated Bax and Casp-3a (like in Figure 3C). Asterisks indicate a significant reduction of apoptotic parameters measured in tetraploid as compared to diploid cells (P<0.01, unpaired Student's t-test, X±s.e.m., n=3). (E) Systematic comparison of distinct cytotoxic compounds on diploid and tetraploid cells. The IC50 values were determined by MTT assays on 4 diploid and tetraploid clones of each cell lines. (F) Apoptotic response of tetraploid cells to UVC and γ-irradiation. Diploid and tetraploid RKO cells were analyzed 3 days post-treatment for loss of the ΔΨm (with TMRM staining) and DNA loss (with Hoechst 33342). Asterisks indicate significant differences dictated by the ploidy status (P<0.01, nonpaired Student's t-test, X±s.e.m., n=4). (G) Acute tetraploidization of MEF and their effect on the cisplatin response. Wild type MEF were treated for 48 h with 17-AAG, which caused an accumulation of ∼60% of cells with an 8N DNA content (as determined by Hoechst 33342 staining. Such cells (as well as cells with 2N DNA content) were FACS purified and treated with CP or STS for further 48 h, followed by determination of cell death with the crystal violet assay. (H, I). Tumor growth of untreated (G) or cisplatin-treated (H) RKO cells in vivo. Diploid (DY) or tetraploid (TA) RKO clones were injected subcutaneously into athymic nu/nu mice (n=10) and tumor growth (X±s.e.m.) was determined with a caliper. The animals (n=10 per group) were treated on day 12 by intraperitoneal injection of cisplatin (in H).
Figure 7
Figure 7
Mechanisms of cisplatin resistance in tetraploid cells. (A, B) Assay for the simultaneous detection of diploid and tetraploid cells dying with cisplatin. The GFP-H2B-expressing diploid RKO clone DY was mixed with the GFP-negative tetraploid RKO clone T1 at a 1:1 ratio (in A), followed by culture for 5 days in the absence of cytotoxic drugs (control) or in the presence of cisplatin or staurosporine (STS), and then stained with TMRM to determine the proportion of dying diploid and tetraploid cells. Note the increase in the relative frequency of diploid cells in untreated control cultures, irrespective of the initial diploid: tetraploid (D:T) ratio (1:1 in (A) or 9:1, 1:1 or 1:9 in (B)), while cisplatin increases the percentage of tetraploid cells in the cultures. Similar results indicating an enhanced resistance of tetraploid cells against cisplatin were obtained when tetraploid H2B-GFP-expressing clones were co-cultured with diploid GFP-negative clones (not shown). (C) Effect of cyclic pifithrin-α (Pif) on the D:T ratio. Cells (inital ratio 1:1) were cultured in the absence of presence of cisplatin, oxaliplatin and/or cyclic pifithrin-α (doses in μg), and the D:T ratio of the cultures was determined after 5 days. (D) Effect of small-interfering RNA designed to downregulate p53R2 on the death of representative diploid (DY, D5) and tetraploid RKO (TA, T1) clones. Cells were transfected with siRNAs specific for p53R2(440) or emerin, and 36 h later the cells were treated with cisplatin for 2 days, and the frequency of dying (TMRMlow) cells was measured. The immunoblot demonstrates the efficacy of p53R2 440 on p53R2 protein expression, as tested on a pool of RKO-derived clones. Similar functional results were obtained for a second p53R2-specific siRNA (UTR, not shown). (E) Effect of other p53 target genes on the cisplatin response. Specific siRNAs were used to downmodulate emerin (Co), FDXR, GADD45A, BAX or Puma, and the frequence of dying (TMRMlow) cells (X±s.e.m., n=3) was determined after addition of 20 μM cisplatin for 2 days. Note that the values of spontaneous apoptosis (obtained in the absence of cisplatin) are contained in Figure 5F. Asterisks in (C–D) indicate significant (P<0.01) apoptosis-inhibitory effects.

References

    1. Adams JM (2003) Ways of dying: multiple pathways to apoptosis. Genes Dev 17: 2481–2495 - PubMed
    1. Andreassen PR, Lohez OD, Lacroix FB, Margolis RL (2001) Tetraploid state induces p53-dependent arrest of non-transformed mammalian cells in G1. Mol Biol Cell 12: 1315–1328 - PMC - PubMed
    1. Barrett MT, Pritchard D, Palanca-Wessels C, Anderson J, Reid BJ, Rabinovitch PS (2003) Molecular phenotype of spontaneously arising 4N (G2-tetraploid) intermediates of neoplastic progression in Barrett's esophagus. Cancer Res 63: 4211–4217 - PubMed
    1. Bourdon JC, Deguin-Chambon V, Lelong JC, Dessen P, May P, Debuire B, May E (1997) Further characterisation of the p53 responsive element—identification of new candidate genes for trans-activation by p53. Oncogene 14: 85–94 - PubMed
    1. Castedo M, Ferri K, Roumier T, Metivier D, Zamzami N, Kroemer G (2002a) Quantitation of mitochondrial alterations associated with apoptosis. J Immunol Methods 265: 39–47 - PubMed

Publication types

MeSH terms