. 2006 Jun 7;25(11):2397-408.
doi: 10.1038/sj.emboj.7601125. Epub 2006 May 4.

Displacement of D1, HP1 and topoisomerase II from satellite heterochromatin by a specific polyamide

Affiliations

Displacement of D1, HP1 and topoisomerase II from satellite heterochromatin by a specific polyamide

Roxane Blattes et al. EMBO J. .

Abstract

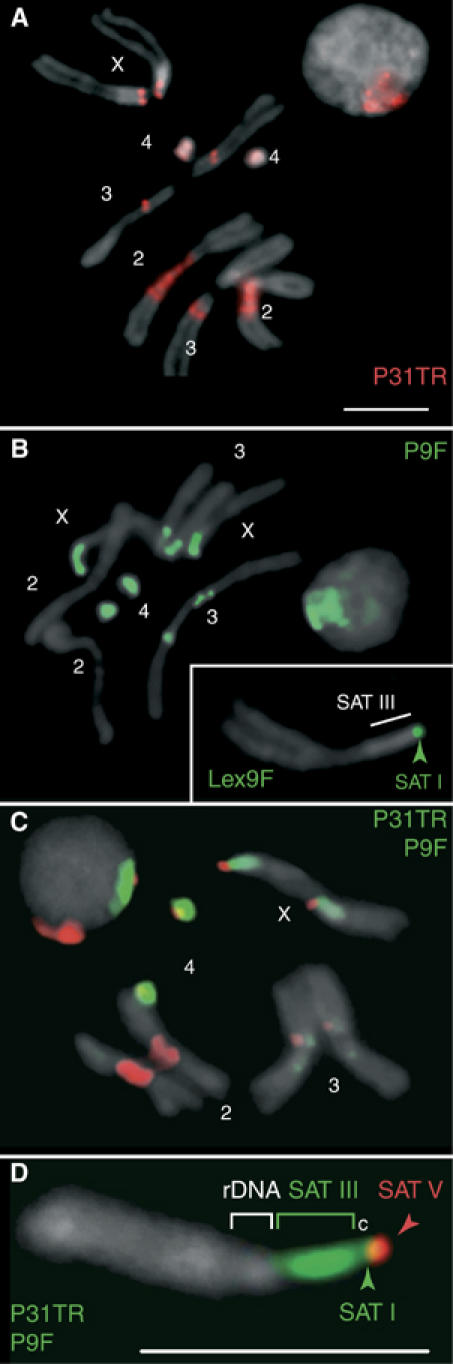
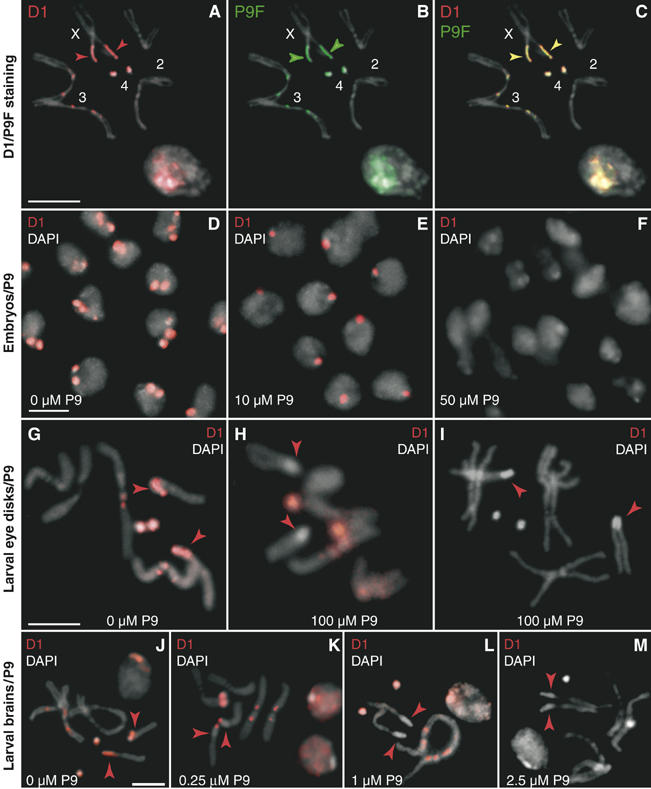
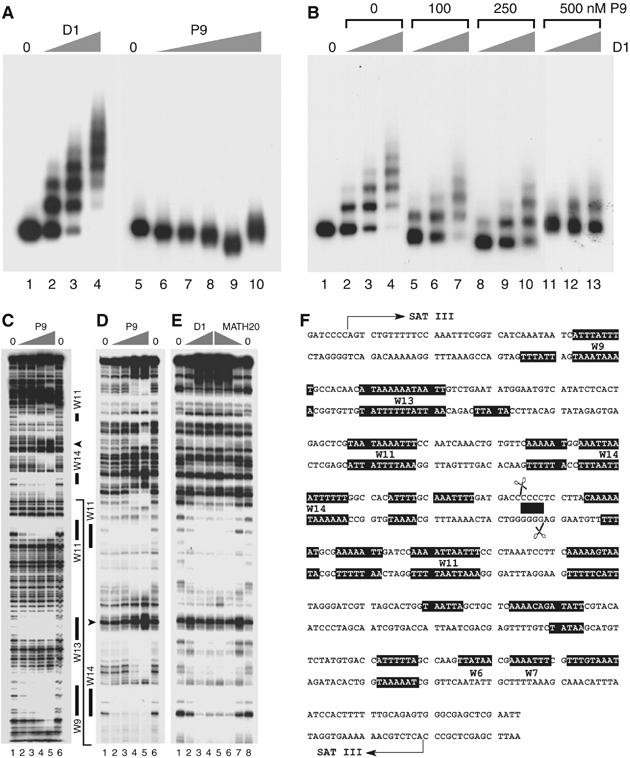
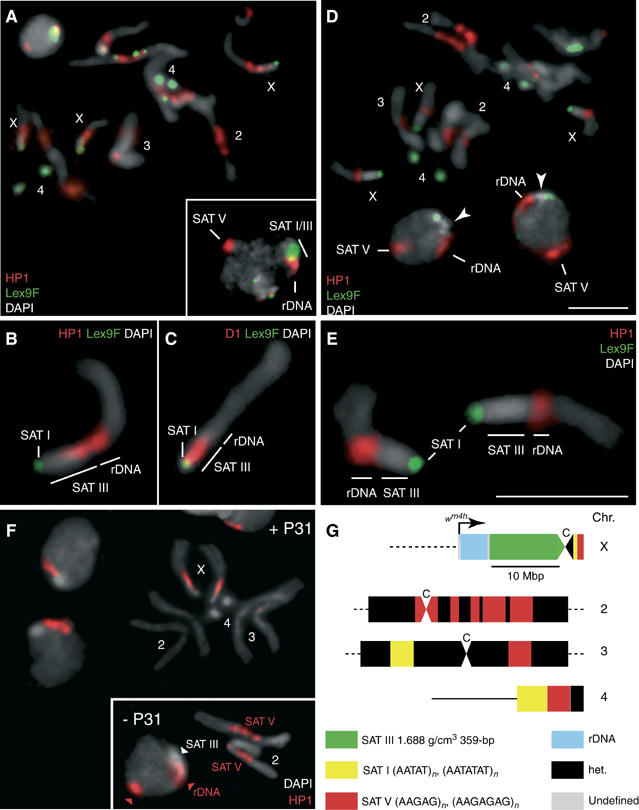
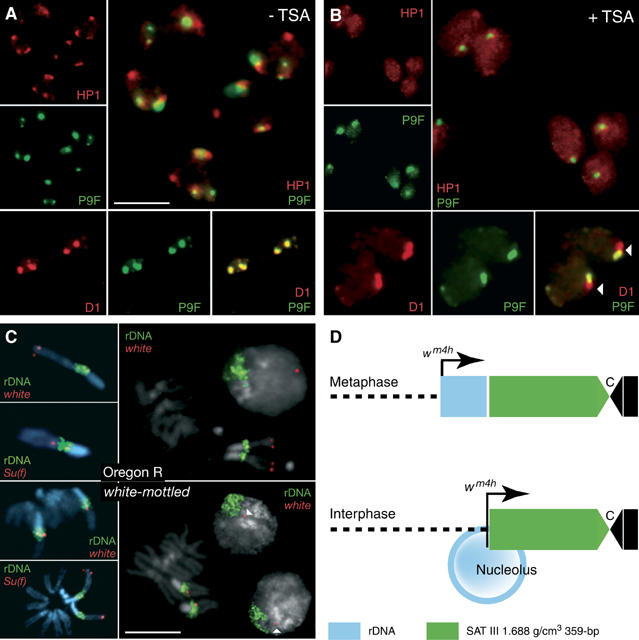
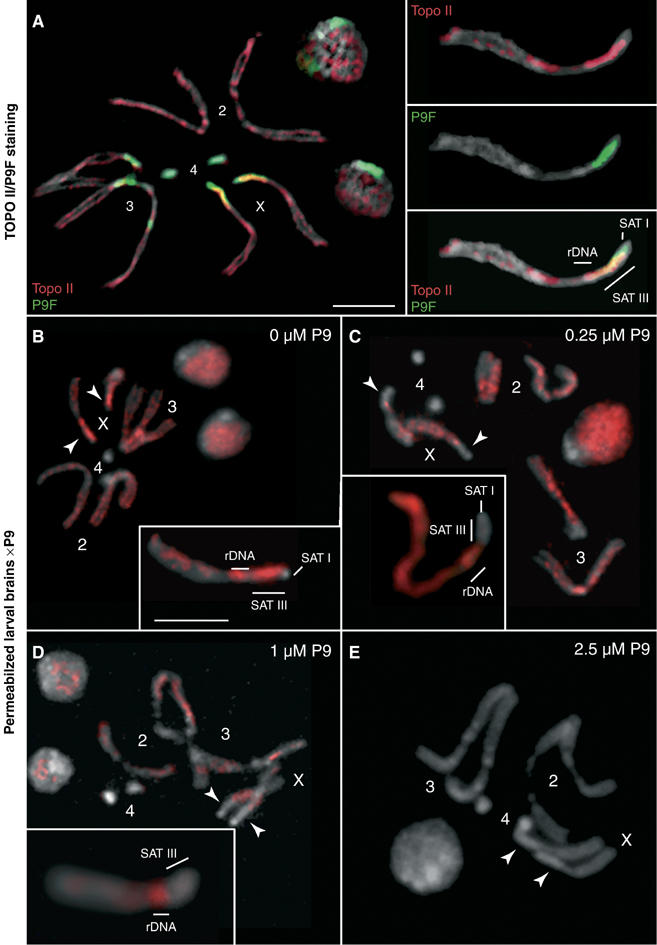
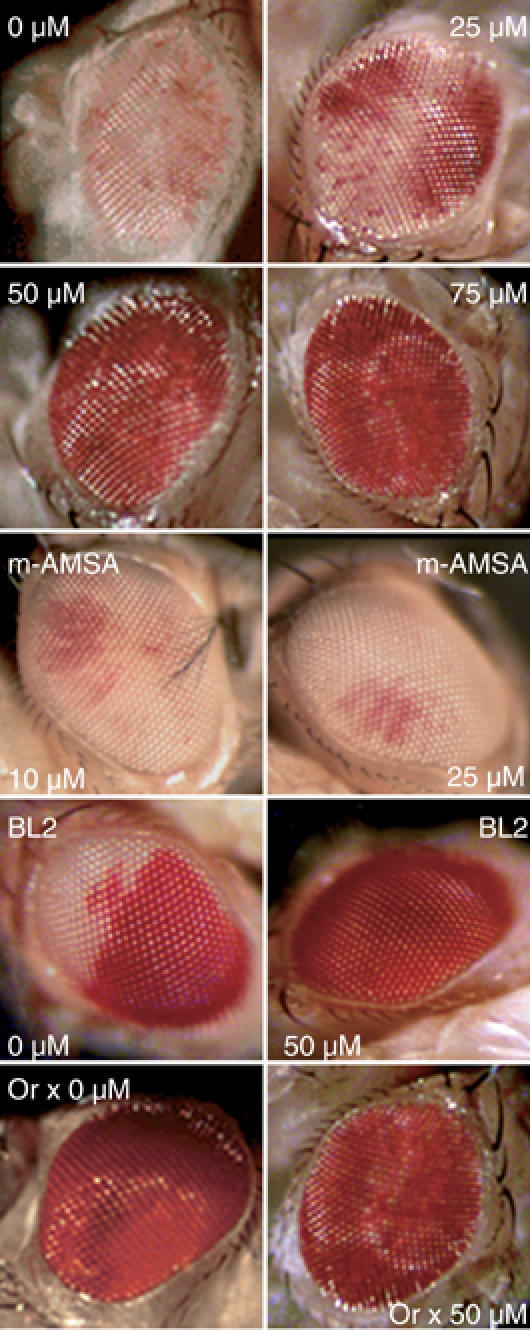
The functions of DNA satellites of centric heterochromatin are difficult to assess with classical molecular biology tools. Using a chemical approach, we demonstrate that synthetic polyamides that specifically target AT-rich satellite repeats of Drosophila melanogaster can be used to study the function of these sequences. The P9 polyamide, which binds the X-chromosome 1.688 g/cm3 satellite III (SAT III), displaces the D1 protein. This displacement in turn results in a selective loss of HP1 and topoisomerase II from SAT III, while these proteins remain bound to the adjacent rDNA repeats and to other regions not targeted by P9. Conversely, targeting of (AAGAG)n satellite V repeats by the P31 polyamide results in the displacement of HP1 from these sequences, indicating that HP1 interactions with chromatin are sensitive to DNA-binding ligands. P9 fed to larvae suppresses the position-effect variegation phenotype of white-mottled adult flies. We propose that this effect is due to displacement of the heterochromatin proteins D1, HP1 and topoisomerase II from SAT III, hence resulting in stochastic chromatin opening and desilencing of the nearby white gene.


Figures

Figure 1
Figure 1
Localization of satellites in diploid cells using fluorescent polyamides. (A–D) Brains dissected from female third-instar larvae were fixed and stained using fluorescent polyamides and counterstained with DAPI (gray). The properties of the drugs are described in Supplementary Table I. P31TR (A) detects satellite V, P9F (B, D) satellites III and I, Lex9F (inset in B) satellite I. SAT I, III and V maps are diagrammed in Figure 4G below. A sample double-stained with P9F and P31TR is shown in (C). The localization of satellite and rDNA repeats is shown for a magnified X chromosome double-stained with P9F and P31TR (D; c: centromere). Scale bars: 5 μm.
Figure 2
Figure 2
Uptake of oligopyrroles by whole embryos and larvae and displacement of D1. (AC) Larval neuroblast nuclei and mitotic chromosomes stained with an antibody against D1 (red) and P9F (green) and counterstained with DAPI (gray). (DF) Cellular blastoderm embryos were treated with 0, 10 or 50 μM P9, immunostained for D1 (red) and mounted in DAPI (gray). Treatment with 10 μM P9 results in a partial loss of the D1 signal, which is complete at 50 μM P9. (GI) Third-instar larvae were fed colchicine (100 μg/ml) and P9 (0 or 100 μM) to assess displacement of D1 (red signal) from SAT I and SAT III repeats on mitotic chromosomes from eye imaginal disks. Arrowheads indicate the position of SAT III repeats, as determined by P9F staining (not shown). (JM) The D1 signal in permeabilized larval brains treated with 0, 0.25, 1 or 2.5 μM P9, respectively. Merged DAPI (gray) and D1 (red) signals are shown. Arrowheads show the DAPI-bright SAT III array on the X chromosome. Scale bars: 5 μm.
Figure 3
Figure 3
The P9 oligopyrrole competes with D1 for binding to SAT III repeats in vitro. (A) A SAT III monomer was incubated with 2, 5 or 10 ng D1 (2.7, 6.75 and 13.5 nM, lanes 2–4) or P9 (25, 50, 100, 250 or 500 nM, lanes 6–10). No-protein controls are shown in lanes 1 and 5. (B) SAT III was incubated with 1, 5 or 10 ng D1 (1.35, 6.75 or 13.5 nM) in the presence of 0, 100, 250 or 500 nM P9 as shown above the gel. Lane 1 contained no protein. The displacement of D1 by the drug is almost complete at 500 nM P9 (lanes 11–13). (C) SAT III monomer DNA 3′-end labeled on the lower strand was incubated with 0 (lanes 1 and 6) or 50, 100, 250, 500 nM P9 (lanes 2–5) and digested with DNAse I. Solid bars denote regions protected from digestion at the lowest P9 concentrations used and correspond to the largest dA·dT tracts (W) of SAT III (W6/W7–W14, where the number denotes the number of dA·dT bp). Note that only W tracts that are clearly resolved on the gels shown are indicated. The arrowhead indicates a P9-induced hypersensitive site. Binding of the same concentrations of P9 to SAT III (D) was compared to that of D1 and MATH20 (E). Lanes 2–4 of panel (E) correspond to 2, 5 and 10 ng D1 (2.7, 6.75 and 13.5 nM), while lanes 5–7 contained 2.5, 1.5 and 0.5 ng MATH20 (1.5, 0.9 and 0.3 nM). Lanes 1 and 8 are no-protein controls. The solid line starting at the bottom of (D) indicates the SAT III region shown on these gels relative to (C). These results are summarized on the sequence of a SAT III monomer shown in (F). Filled boxes indicate the regions protected by binding of D1, MATH20 and P9. Scissors indicate the sequence cleaved by topoisomerase II in vivo (Borgnetto et al, 1996), the filled box corresponds to the four consecutive dC·dG bp located within the staggered cut. This region spans the P9-induced DNAse I-hypersensitive site and is not bound by D1 or MATH20.
Figure 4
Figure 4
D1 Displacement results in a selective loss of HP1. (A) Localization of HP1 (red) in interphase nuclei and mitotic chromosomes of female diploid larval neuroblasts. Samples were counterstained with Lex9F (green) and DAPI (gray). The inset shows a similarly stained interphase nucleus. A region that stains strongly for HP1 alone corresponds to SAT V repeats on chromosome 2, as assessed by P31TR staining (not shown). rDNA repeats are indicated. (B, C) Magnified X chromosomes after staining for HP1 or D1 (red), respectively, and counterstaining with Lex9F (green) and DAPI (gray). (DE) Localization of HP1 (red) after treatment with 2.5 μM P9. Magnified X chromosomes are shown in (E). Samples were counterstained with Lex9F (green) and DAPI (gray). In (D), arrowheads indicate the HP1-depleted DAPI-bright region that corresponds to SAT III repeats in interphase nuclei after treatment with P9; SAT V repeats on chromosome 2 are also indicated. (F) The localization of HP1 following treatment with P31. The inset shows untreated chromosomes 2 and a nucleus with the SAT V-associated HP1 signal (arrowhead). A general representation of major satellite blocks is schematized in (G), which also shows the approximate location of the white gene on a wm4 X chromosome, within a type I insertion sequence characteristic of some rDNA repeats. ‘C' denotes the centromere. Scale bars: 5 μm.
Figure 5
Figure 5
SAT III and rDNA repeats define alternative D1 and HP1 domains. Neuroblasts from control (A) or TSA-fed (B) third-instar larvae were immunostained for HP1 or D1 (red) and counterstained with P9F (green). Individual and merged signals are as indicated in the photographs. TSA feeding induces a delocalization of HP1 to the nucleoplasm and an extension of the D1 signal from SAT III to an adjacent P9F-negative region that corresponds to the rDNA repeats. (C) The results of FISH experiments performed with white and Su(f) probes (red) or a full-length rDNA probe (green). Photographs at the top and bottom show results obtained from wild-type Oregon R or wm4 neuroblasts, respectively. Arrowheads indicate the white signal detected in interphase nuclei. Scale bars: 5 μm. (D) The juxtaposition of the rDNA-linked white gene to SAT III repeats as a result of looping out of rDNA sequences in the nucleolus.
Figure 6
Figure 6
Localization of topoisomerase II and displacement from SAT III by P9. (A) Neuroblasts from female third-instar larvae were immunostained for topo II (red) and counterstained with P9F (green) and DAPI (gray). Individual chromosomes are numbered as shown. The localization of SAT I, SAT III and rDNA repeats is indicated in the inset showing a magnified X chromosome. SAT III repeats are associated with a particularly strong topo II signal, the adjacent region spanning the 3.5-Mbp rDNA repeats is also stained. Photographs to the right show the individual topo II, P9F and merged signals. In panels (B–E), third-instar female larval brains were permeabilized and treated with 0, 0.25, 1 and 2.5 μM P9, respectively. Drug treatment leads to a delocalization and displacement of topo II that is selective for SAT III repeats at low to intermediate concentrations of the drug (250 nM to 1 μM, C and D), while topo II remains associated with rDNA repeats (see magnified X chromosomes in insets). Topo II is completely displaced from nuclei and mitotic chromosomes at the highest drug concentration tested (2.5 μM, E). Arrowheads indicate the position of SAT III repeats. Samples were counterstained with DAPI (gray). Scale bars=5 μm.
Figure 7
Figure 7
Treatment with VM26, a topoisomerase II poison, suppresses white-mottled PEV. Third-instar larvae from the wm4h, Tp(3;Y)BL2 (‘BL2') and Oregon R (‘Or') lines were fed VM26 or m-AMSA at the indicated concentrations. Representative eyes of 5-day-old adult flies are shown and correspond to those observed in >80% of hatched flies (n=30 for each drug concentration). Eyes from untreated or VM26-treated wild-type Oregon R flies are shown for comparison. Extracted eye pigments from two independent feeding experiments were measured for absorbance at 480 nm and yielded the following values: 0.18±0.03 (wm4h, 0 μM VM26); 0.36±0.05 (wm4h, 25 μM VM26); 0.79±0.05 (wm4h, 50 μM VM26); 0.91±0.03 (wm4h, 75 μM VM26); 0.22±0.06 (wm4h, 10 μM m-AMSA); 0.21±0.03 (wm4h, 25 μM m-AMSA); 0.43±0.05 (BL2, 0 μM VM26); 0.92±0.04 (BL2, 50 μM VM26); 0.92±0.02 (Oregon, 0 μM VM26); 0.89±0.02 (Oregon, 50 μM VM26).

References

    1. Adachi Y, Luke M, Laemmli UK (1991) Chromosome assembly in vitro: topoisomerase II is required for condensation. Cell 64: 137–148 - PubMed
    1. Agostinho M, Rino J, Braga J, Ferreira F, Steffensen S, Ferreira J (2004) Human topoisomerase IIalpha: targeting to subchromosomal sites of activity during interphase and mitosis. Mol Biol Cell 15: 2388–2400 - PMC - PubMed
    1. Ahmad K, Henikoff S (2002) The histone variant H3*3 marks active chromatin by replication-independent nucleosome assembly. Mol Cell 9: 1191–1200 - PubMed
    1. Aravin AA, Lagos-Quintana M, Yalcin A, Zavolan M, Marks D, Snyder B, Gaasterland T, Meyer J, Tuschl T (2003) The small RNA profile during Drosophila melanogaster development. Dev Cell 5: 337–350 - PubMed
    1. Aulner N, Monod C, Mandicourt G, Jullien D, Cuvier O, Sall A, Janssen S, Laemmli UK, Käs E (2002) The AT-hook protein D1 is essential for Drosophila melanogaster development and is implicated in position-effect variegation. Mol Cell Biol 22: 1218–1232 - PMC - PubMed

Publication types

MeSH terms